How to chart a scoping review with AI
An AI-assisted way to chart the included sources of a scoping review: one structured record per report, every value carrying the text it came from, then verified by hand against the source before anything is counted.
This is for researchers writing a review article for publication in an academic journal.
Say you are a doctoral student or a research fellow, and your project is to survey what has already been published on a question: not to run a new experiment, but to map the studies other people have already done. You have searched the literature databases, sifted a few hundred titles down to the forty journal articles that qualify, and those forty PDFs are now sitting in a folder on your desktop.
The next job is the one nobody warns you about. You have to open all forty papers and pull the same handful of facts out of every one of them, into one spreadsheet: how many people were in each study, in which country, using what, measuring what, funded by whom. Forty papers, fourteen columns. That spreadsheet is what your analysis rests on, what goes in your manuscript, and what a peer reviewer will test.
In a scoping review that step is called charting. In a systematic review it is called data extraction. The mechanics overlap, but systematic-review extraction may also require outcome definitions, duplicate extraction, appraisal and synthesis controls that are outside this guide. This guide is about that one step, in detail, and nothing on either side of it.
Keep reading if you have finished screening, you are looking at that folder and that empty spreadsheet, and you would rather not spend the next ten evenings copying numbers by hand.
Stop here if any of these is you:
- You have not finished searching and screening. This step comes after, and starting it early will cost you more than it saves.
- You want help finding the papers. Nothing here searches a database or decides what is eligible.
- You want a judgment on how good the studies are, or on what the evidence means. Neither is charting, and neither is in this guide.
- You want to hand the job over. Everything below produces draft values that a human has to check against the source before they can be published. If nobody is going to do that, this method will make you faster at being wrong.
Doing a systematic review rather than a scoping review? The charting mechanics transfer directly. The reporting standard and the appraisal requirements do not, so take the method and check it against your own guidance.
The method here uses AI to draft that table: the same fields pulled from every source, each value carrying the exact text it came from and where in the paper that text sits. Everything it produces is a candidate value. You check each one against the source, correct what is wrong, add what it missed, and lock the result. Only that locked dataset goes anywhere near your manuscript.
The tool I use is docAnalyzer (docanalyzer.ai), and two things about it are what make the method work rather than being nice to have. It runs one instruction against each paper separately and returns a structured record per paper, so forty papers give you forty comparable rows instead of one blended summary. And every reported field comes back with a supporting extract and its location in the paper. The form asks for them and Step 7 is where you find out whether what came back is really there, but a field carrying a quote and a page is one you can check in ten seconds instead of rereading the article. A different tool may serve if, on your pilot sources, it produces one identifiable record per report, preserves the complete structured output, handles the formats you rely on, gives field-level locators a human can follow, and permits an auditable export under your institution's data and licence rules. A tool doing neither cannot support the verification step below, and without that step none of this is publishable.
A word on vocabulary, because getting it wrong here breaks your counts later. A source of evidence is what you included. A report is one published item describing it, and one source can have several: a main article, a supplement, a correction. A study is the underlying piece of research, and two reports can describe the same study. PRISMA-ScR says "sources of evidence" rather than "studies" on purpose, because a scoping review often includes policies, guidelines and reports that are not studies at all. This guide charts at the level of the report you uploaded, then consolidates. Keep the three words apart and the arithmetic works.
The whole job: you have already decided what is in, and now you need the same fields out of every source, recorded the same way, with a trail back to where each value came from, verified by a human before anything is published from it.
Before you upload: what has to be true
This is a gate, not an introduction. The tool sees the reports you give it and nothing else. It does not search MEDLINE, Embase, CINAHL, Scopus or a trials register. It does not deduplicate. It does not screen, and it does not decide eligibility. It cannot know about a source that was never retrieved.
Do not upload until all of these hold:
- A dated a priori protocol fixes your PCC, eligibility criteria, sources to be searched, reviewer roles and charting plan. Register or publish it. PROSPERO does not accept scoping reviews, so use OSF, Figshare or a protocol journal.
- The exact strategy, platform, limits, date run and yield are saved for every source searched, not just for one database.
- Deduplication method and the before and after counts are preserved.
- At least two reviewers applied the eligibility criteria independently to the same records, at title/abstract and again at full text, compared their decisions and settled the differences, all before production screening started, and every clarification that came out of it is dated. A criterion clarified at record 150 was not the criterion applied to the first 149.
- Title/abstract and full-text selection are complete, with exclusion reasons recorded at full text.
- Every included source of evidence has a stable
evidence_id, and its related reports and supplements are linked to it. - Your search, screening and inclusion counts reconcile.
- Your protocol says you intend to use AI for charting, and why. The 2025 joint position statement from Cochrane, Campbell, JBI and the Collaboration for Environmental Evidence asks for the decision to use AI to be reported as part of protocol development, not disclosed afterwards. Step 10 has the template.
On the search itself: the bullet above asks whether your search is documented, which is not the same question as whether it is adequate. Whether your databases and platforms fit the question, whether the registers, grey literature, websites and citation searching your protocol planned were actually carried out, and whether anything left out was left out on purpose, are judgments. They belong to whoever is qualified to make them on your review, and they belong before charting rather than after a reviewer asks. This guide cannot make them for you and does not try. What it can tell you is that a saved strategy file is evidence that a search happened, not evidence that it was a good one. So write down who made the call: the name and role of the person who confirmed that your databases, platforms and planned register, website, grey literature and citation searching fit the PCC, and anything they asked you to change. If the only name you can write is your own, the gate has told you something worth knowing before a reviewer tells you.
On who screened: JBI's position is that selection should be done independently by at least two reviewers, with disagreements resolved by consensus or a third. If your review used a different arrangement, do not tick this gate simply because one person reached the end of a spreadsheet. Document what you did, complete whatever calibration and independent checking your protocol or your methodologist requires, and get their decision that the residual limitation is acceptable for your target journal before charting starts. Reporting a limitation is not a substitute for the safeguard; it is what you do after the safeguard has been settled.
If the criteria were refined once screening was already under way, the records screened under the earlier reading have to be found and screened again under the final one, with conflicts resolved and the flow counts updated. That is real work and there is no way to word around it. It is also smaller now than it will be after you have charted five hundred fields on a set that was never stable, and smaller than it will be when a peer reviewer asks which version of your criteria each record was screened under.
If charting later exposes a missing source, a search term you never ran, a citation chain you never followed, a source type nobody planned for, or an eligibility question, stop. Do not fix it in the charting form. Record a dated protocol amendment, decide with whoever owns the search which searches and selection decisions are affected, rerun them, update the exclusion reasons and the flow counts, and only then resume. Fixing an eligibility problem downstream is how criteria drift enters a review, and it is the failure a methodologist will find fastest.
Before any client or licensed material goes in, settle the boring questions: does your institution permit these files in this tool, what do your licences say about uploading full text, how is access controlled, how do you delete, and are uploads used to train a model. Do that once, in writing, before the first upload rather than after.
The first two are yours and nobody can answer them for you. For the rest, since this guide names a tool, here are its answers rather than leaving you to hunt for them. docAnalyzer does not use uploaded documents to train AI models. Documents are encrypted in transit and at rest, scoped to your account by row-level security, and deleted when you delete them or close the account, with account data following within thirty days. Documents are stored and processed in the United States. The text of a source also goes to whichever model provider answers your question, which is inherent to how any of this works rather than a property of one product, so jurisdiction there follows the model rather than the tool: the default this guide runs on is OpenAI's, in the United States, while the catalogue also carries models from providers outside it. If your institution would rather that inference ran on an account they hold, BYOK mode in the chat settings uses your own API key. All of this is in the privacy policy at docanalyzer.ai/privacy-policy, which is the version that governs rather than this paragraph, and if your institution needs a data processing agreement or a particular retention arrangement, ask before you upload rather than after.
What this does and does not do
It does not conduct critical appraisal, effect synthesis or interpretive synthesis.
It does perform descriptive handling of your charted data: grouping, counting, mapping. That is a real methodological activity with a reporting home, and pretending otherwise is how the categorisation rules go unreported. Step 9 says what to record.
On appraisal, one attribution worth getting right: JBI is the methodological source for critical appraisal not being required in every scoping review. PRISMA-ScR is a reporting guideline, and it tells you what to report if you did appraise. If you appraise, justify and report it.
The thing that makes this worth doing, and the thing that will bite you
Charting by hand is slow in a specific way. Not the reading, the transcribing. You read a report in twenty minutes and spend another fifteen moving fourteen fields into fourteen columns without fumbling one. Across forty sources that is ten hours of clerical work in which your attention is the failure point.
The bite has two halves, and most people only guard against the first.
The obvious half: a model can assert something the source does not say. I ran thirty papers through this and got 633 charted fields. I then checked every extract that did not match its source, by hand. One was genuinely wrong, and it is worth seeing what wrong looks like, because it is not what people expect.
The paper says "Prespecified harms, including procedure-related adverse events, were systematically captured at follow-up appointments." What came back was "Prespecified harms, including procedure-related adverse events, oral anticoagulation were systematically captured at follow-up appointments." Two words inserted into an otherwise exact quote, lifted from the sentence immediately before it, and the charted value then listed oral anticoagulation among the harms that were captured. Nothing about it reads as invented. It is the same sentence, and it says something the paper does not.
The half people miss: a model can leave something out, and nothing in the output tells you. Checking the values you got back cannot reveal an outcome that was never proposed. This matters most where the value lives in a table, a figure or a supplement rather than in a sentence, which is exactly where trial outcomes and participant characteristics usually live. A form that asks for a quotation will call those absent.
You will also be tempted to select all your sources, open one chat, and ask for a comparison table. Do not. Not because the sources get confused with each other, they mostly do not. Because that gives you one citation per row, and the unit you have to verify is the field.
The tool, and what it calls things
Several things in docAnalyzer are proper nouns rather than ordinary words. These four matter most, and the steps below lean on all of them.
It can also inspect the page images in supported files, not only the extracted text. That is what makes the rule in Step 3 about tables and figures a real instruction rather than wishful thinking, and it is worth confirming in your own tool before you rely on it, because a text-only reader will report every value that lives in a table as missing.
A document is one file you have uploaded, and they live under Documents in the sidebar. A label is a tag you create on the Labels page and pin onto a group of documents so you can work with them as a set. A workflow runs one instruction across a whole set at once, and you reach the list of them through Run a workflow.
The workflow this guide uses is the one whose card reads Individual. Its own screen is headed Ask each document, which is the better name for what it does and the one I use from here on. Both names are the same thing, and knowing that saves you hunting for a card that does not exist. Return structured JSON is a switch on that screen: with it on, each source comes back as a JSON object instead of prose, and the field below becomes JSON output description, where you describe the shape you want.
Read the name literally, because it governs Step 1. It returns one result per uploaded file. Not one per study, not one per source with its supplements folded in. One per file.
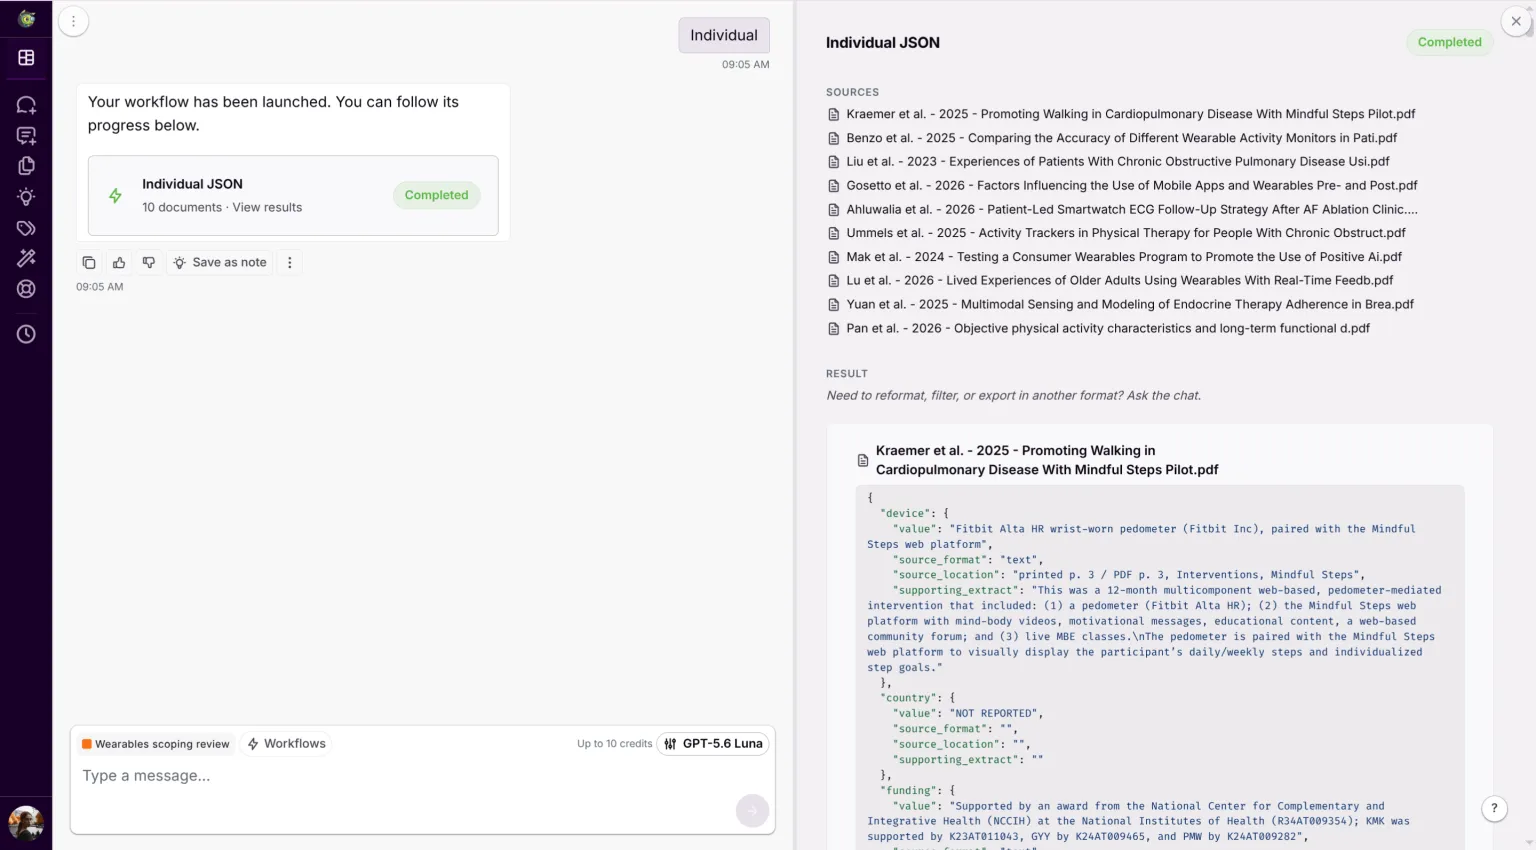
Results appear in your chat as a chip. Click it and a panel opens listing every source with its result underneath, as a formatted JSON block per source rather than a table. That panel holds the complete per-file output and is the record. It is not a working surface: you cannot sort it, filter it, annotate it or click through from a value to the page it came from. The chat beside it is where you turn it into something you can use, and the panel says so, in a line under the results: "Need to reformat, filter, or export in another format? Ask the chat."
If you already use docAnalyzer
A map for a reader who knows what a label and a workflow are. It points at the steps rather than replacing them, and what it marks in bold is what decides the result. This method removes the transcription, not the checking.
| You, about twenty minutes | Step 1. Build the source inventory: an evidence_id per source of evidence, a study_id per study. It is the spine of everything downstream. |
| You | Step 2. Make the label first, then upload, so the set lands grouped. |
| You | Steps 3–4. Write the charting form from your review question, then pilot it with a second person on a few deliberately awkward sources. A form nobody piloted is not a run you can report. |
| Unattended, about twelve minutes | Step 5. Run the included set on the same form and settings as the pilot. |
| You | Step 6. Open a log and record your decisions in it as you go. |
| You, one turn per source | Step 7. Verify every candidate value against the source with the source open. Until you have, every row carries an empty verdict. |
| You | Steps 8–10. Reconcile the two counts, build figures from the locked dataset only, and keep what the report needs. |
Step 1. Build a source inventory before you upload anything
Give every included source of evidence an evidence_id, shared by every report and supplement belonging to it. Give every study a study_id, including a study with only one source behind it; where several sources describe one study, they share the same one. A study_id on a source that stands alone looks redundant and is not: Step 9 counts studies by that column, and a column filled in only where sources needed linking leaves most of your map with nothing to count. Where an included source is not a study at all, a guideline or a commentary you are charting for its content, put NOT APPLICABLE in study_id. It stays in your review and stays out of any count of studies. Record which version of each report you are using.
This inventory is the spine of everything downstream, and building it takes twenty minutes.
Here is why it is not bureaucracy. Ask each document returns one result per file. Upload a main article plus its three supplements and you get four rows for one source, all with the same citation. Upload two reports of one trial and you get two rows for one study. Neither is wrong output; both are wrong data if you treat rows as sources.
So chart at report level first, then consolidate to source and study level, and keep both counts. Consolidation is not a separate pass: the identifiers are joined in Step 6, and Step 7 settles any disagreement between reports of one source with a verdict and a note, like every other decision. The consolidation happens against your inventory: every row carries a document_name, which is the name of the file you uploaded, and your inventory records that filename beside its evidence_id and study_id. You join the two in Step 6, once, before verifying anything, and every count after that reads those columns. Never let a row count stand in for a source count, and never let a source count stand in for a study count. When two reports of one study disagree on a value, record which report you took it from and why, in the same note column you use for corrections. In my set, Benzo 2025 carries seven supplementary files and its outcome definitions live in them rather than in the article. If your form asks for outcomes and you upload only the article, "NOT REPORTED" is what you will get and it will be wrong. Upload the supplements, chart them as their own rows, and consolidate deliberately.
Take the most complete accessible version of each report. Sometimes that is the accepted manuscript rather than the version of record, because it is what your licence or your library allows. Record which version you used, and chase corrections and errata; a retracted or corrected source that you chart from the original is a problem no verification step below will catch.
Step 2. Get them in, and group them
Make the label first so the set lands grouped.
- In the sidebar, click Labels.
- Click Create New Label, type a name for the review, and save.
- In the sidebar, click Documents, then Add.
- Stay on the Files tab. If your library is in Zotero or Mendeley, those are tabs here too, and connecting one beats exporting and re-uploading.
- Before choosing any files, open Apply labels and tick the label you just made.
- Choose your files and upload.
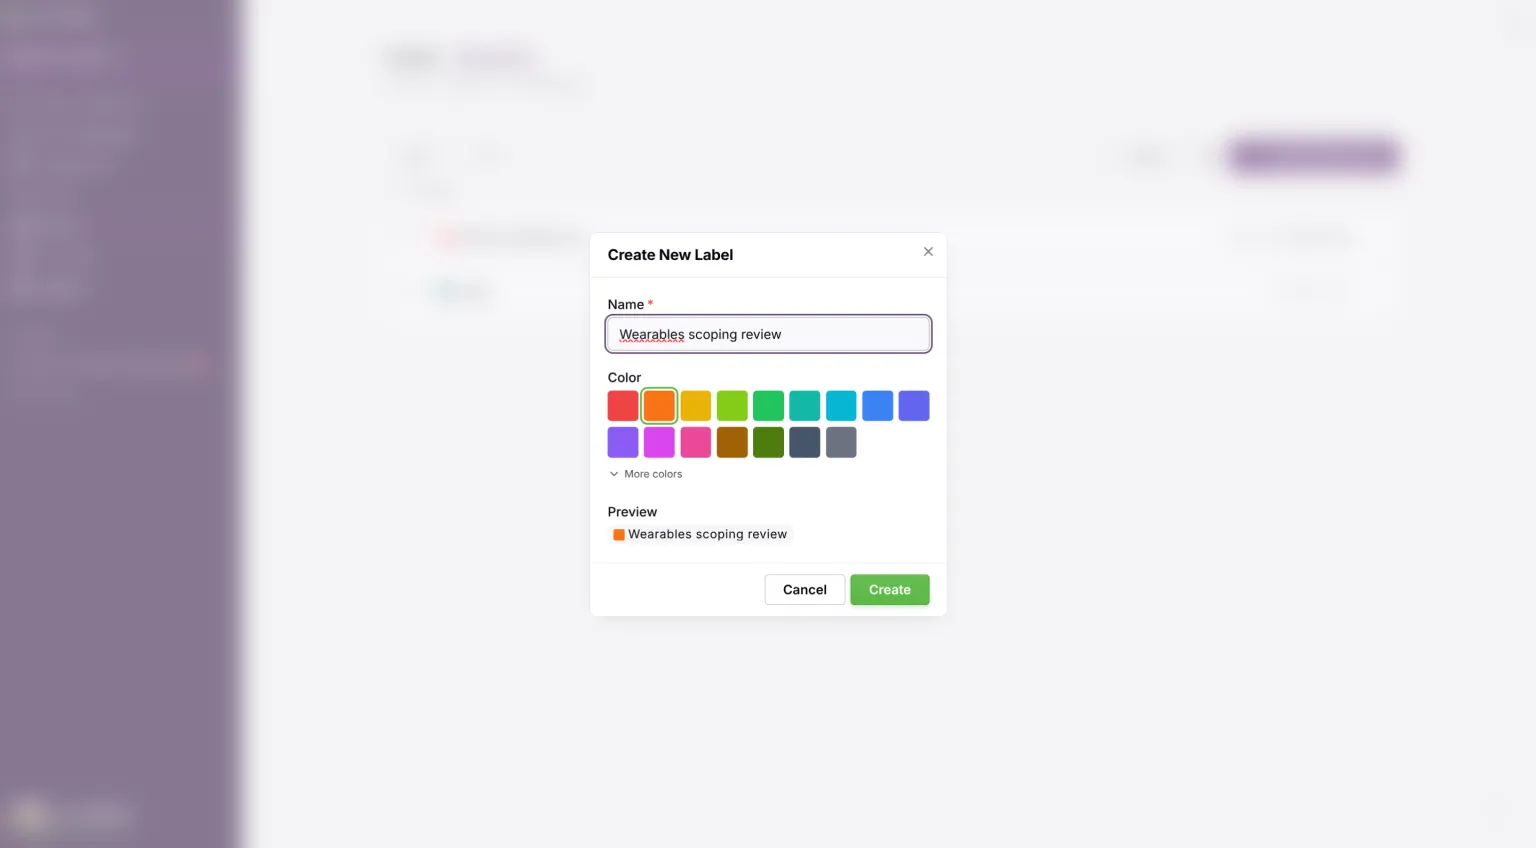
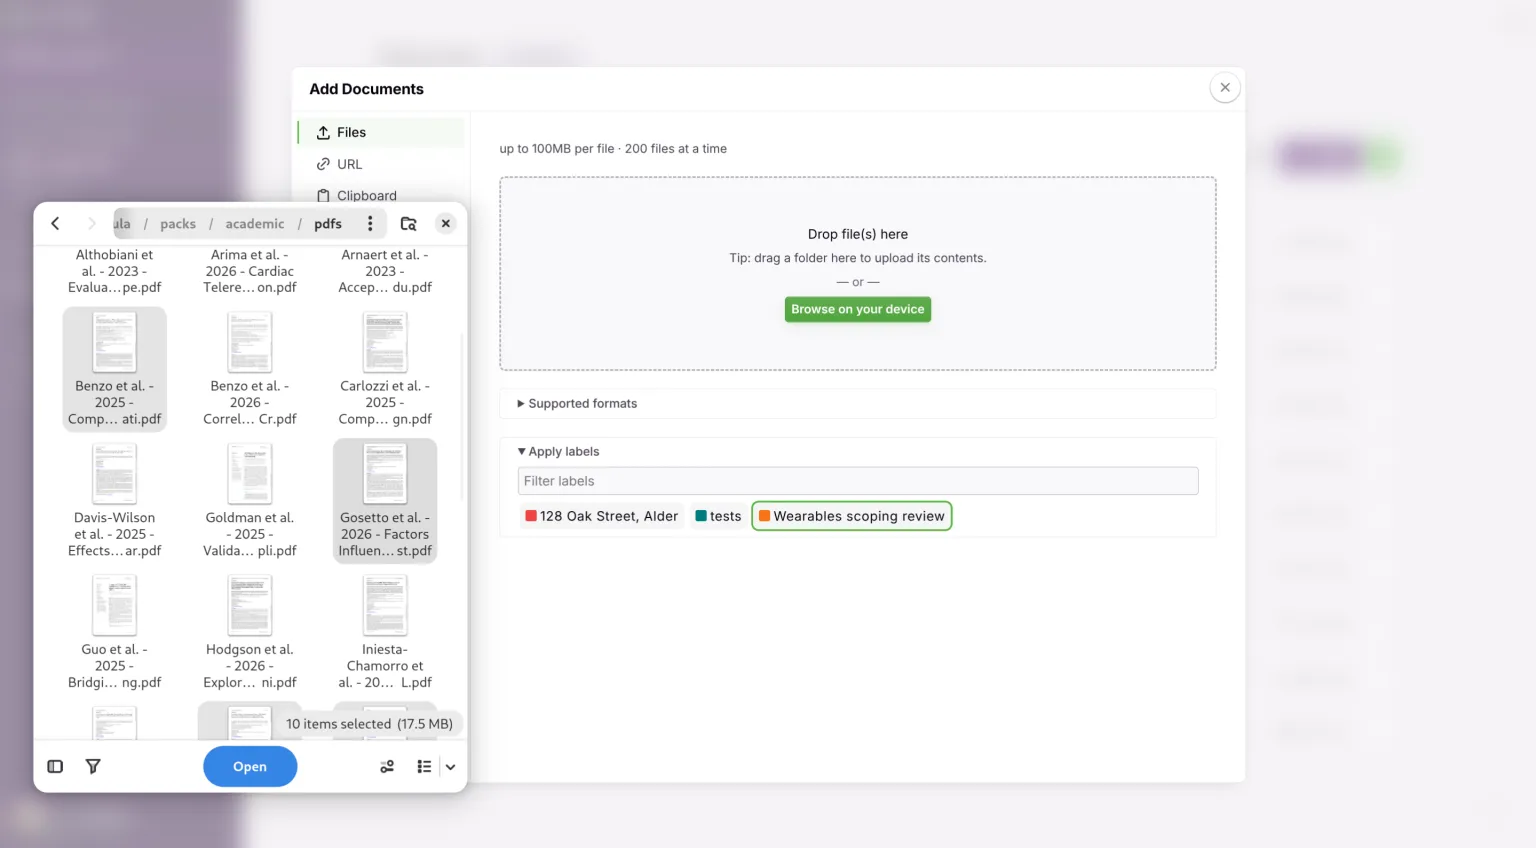
Step 5 is the one people skip. Apply the label as the files go in, since the control is in the upload panel and every step after this one is scoped to it. If you forget, select the documents on the Documents page and use Add labels, which is a correction rather than a redo.
Then wait. Each file is analyzed after it uploads, its row saying analyzing… until it lands, and a document that has not finished is not in the label's set. Let the last one finish before you open the chat. On thirty papers this is minutes, not hours.
The document name is what comes back attached to each result, so your filenames are the join key whether you planned them that way or not. Record each filename in your inventory beside the report it belongs to, and leave the names alone once the files are in.
Two things about the Zotero import are worth knowing before you rely on it. It shows you the first hundred collections and the first hundred items, sorted by title, so a library larger than that arrives incomplete and says nothing about it. And an item that belongs to several collections appears under the first one only, which is not necessarily the collection you made for this review. Neither is a problem if you check the count after importing against your inventory, and both are a problem if you assume the import brought everything.
The browser also only lists items whose file type the app can read. That is a sensible filter and an easy one to misread: an item you expected to see and cannot find has usually not been skipped for being irrelevant, it has been skipped because what is attached to it is a link or a snapshot rather than a file. Chase those by hand rather than concluding they were not in your library.
One label, one included set.
Step 3. Write the charting form
In JBI's method the charting form is a real instrument you design from your review question and register in your protocol. That does not change. What changes is that you write it as a JSON shape.
Start from your PCC. Mine, for the worked example: population, adults living with a chronic condition; concept, consumer wearable devices used for self-management; context, any setting, any country.
Then write the definitions, before you write a single key. A list of field names is not a charting form. Two people given the key country will chart different things, and so will one person on Tuesday and Friday: is it where participants were recruited, where the data were collected, or where the authors work? Every field needs a sentence saying what counts, what does not, and what to do when the source is silent. Register these with your protocol, because PRISMA-ScR asks you to report both your data items and how you charted them, and "we used these thirteen keys" answers neither.
Mine, for the worked example:
| Field | What counts, what does not |
|---|---|
citation |
The source's own full citation, as printed on it. |
country |
Where participants were recruited or data collected. Not author affiliation or corresponding-author address. Multiple countries: list all. Not stated: NOT REPORTED. |
setting |
The care or life context the device was used in: home, clinic, hospital ward, community, laboratory. Not the institution's name. |
design_as_reported |
The design in the authors' own words, verbatim. Never normalised to a taxonomy. |
population |
The people the data come from. If the study surveyed clinicians about their patients, the population is the clinicians. |
device |
The wearable or app, with maker and model as stated. |
self_management_function |
What the device did for the participant in managing their condition. NOT APPLICABLE when it was worn only so researchers could measure something. |
duration |
How long participants used the device. NOT APPLICABLE where nobody wore anything, as in a survey or a protocol with no results. |
outcomes_measured |
What the study set out to measure. One list entry per outcome, in the authors' terms. |
key_findings_candidates |
Findings that may bear on the review question. Proposals for you to adjudicate, not conclusions. |
funding |
The funding statement as given. Absent statement: NOT REPORTED, not "none". |
conflicts |
The declared conflicts. "None declared" is a declaration; no section at all is NOT REPORTED. |
author_stated_limitations |
Limitations the authors state. Never ones you infer on their behalf. |
These sentences go into the form itself, not only into your protocol. A definition the model never sees does not govern anything, and the field it was written for comes back charted to whatever the model assumed instead. That means they now live in two places, so treat them as one thing: editing a definition is a protocol amendment, and it means changing the registered table, changing the form, and rerunning every source already charted.
The unit is one record per uploaded file, which is Step 1's point restated: this form charts reports, and consolidation to sources and studies happens afterwards against your inventory.
Two settings first, because of where the controls live and the order you have to do this in.
- In the sidebar, click Labels.
- Find your label's row and click New Chat on it. This opens a chat scoped to every document under that label.
- Beside the ask box at the bottom is a sliders control. Click it and choose Chat settings.
- Leave Model alone; the default is fine. Raise Thinking Effort to high, and close the panel.
The same row offers Run a workflow, which goes straight to the workflow list. Do not take it yet. Chat settings live on this screen and not on the workflow screen, so jumping to the workflow first means running at settings you never set.
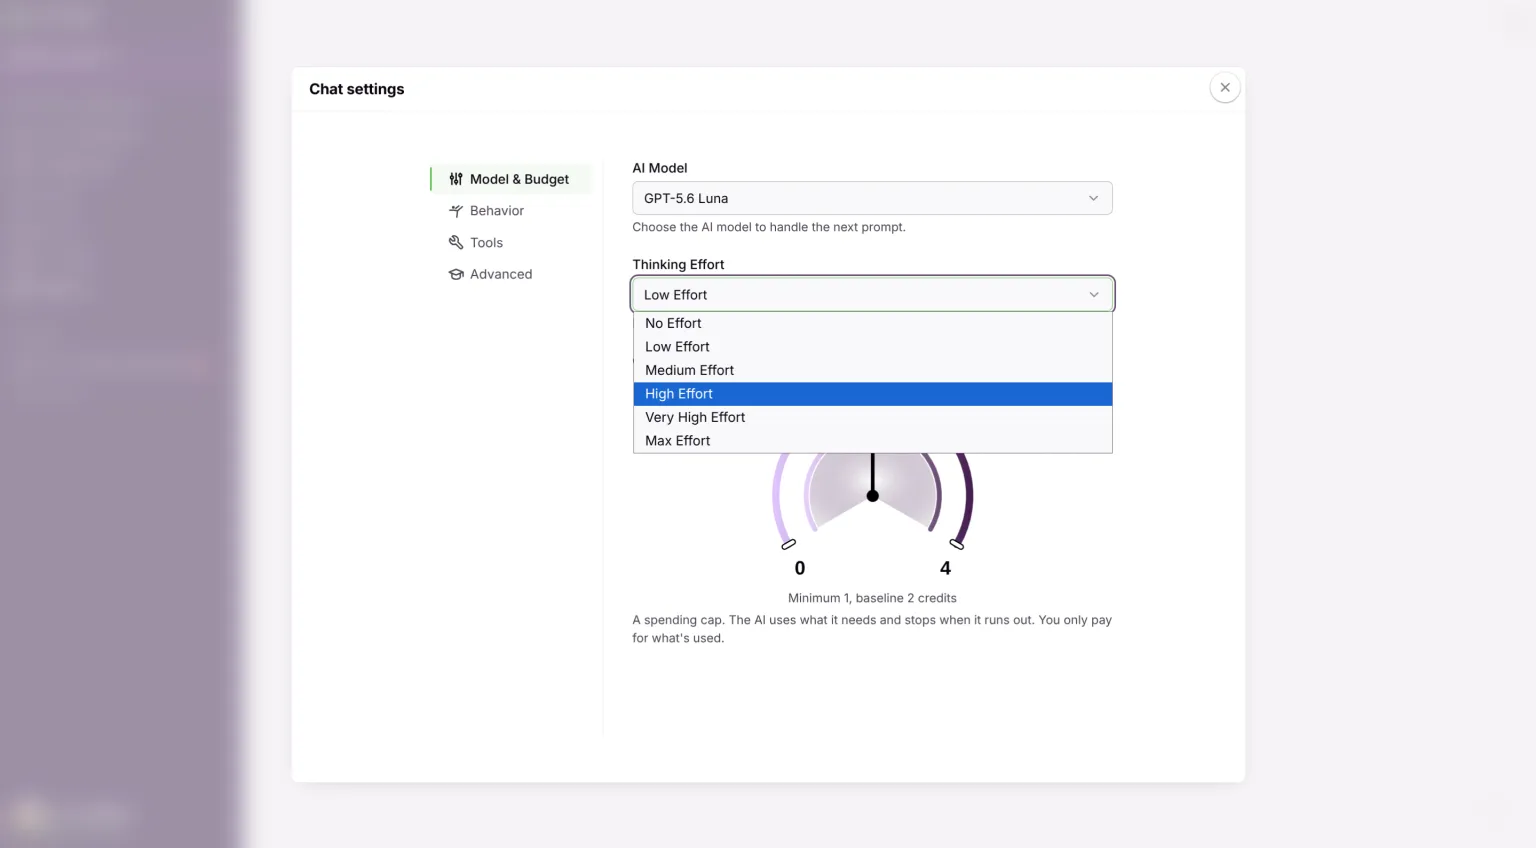
Set it now rather than before the full run. Step 4 pilots this form on five sources, and a pilot at different settings from the real run has not tested the thing you are about to ship.
Now turn each thing you need into a key, and make every key an object rather than a plain value. To get to the form:
- At the bottom of the chat screen you are already on, click Or run a workflow on N documents →.
- In the Run a workflow dialog, click the card reading Individual.
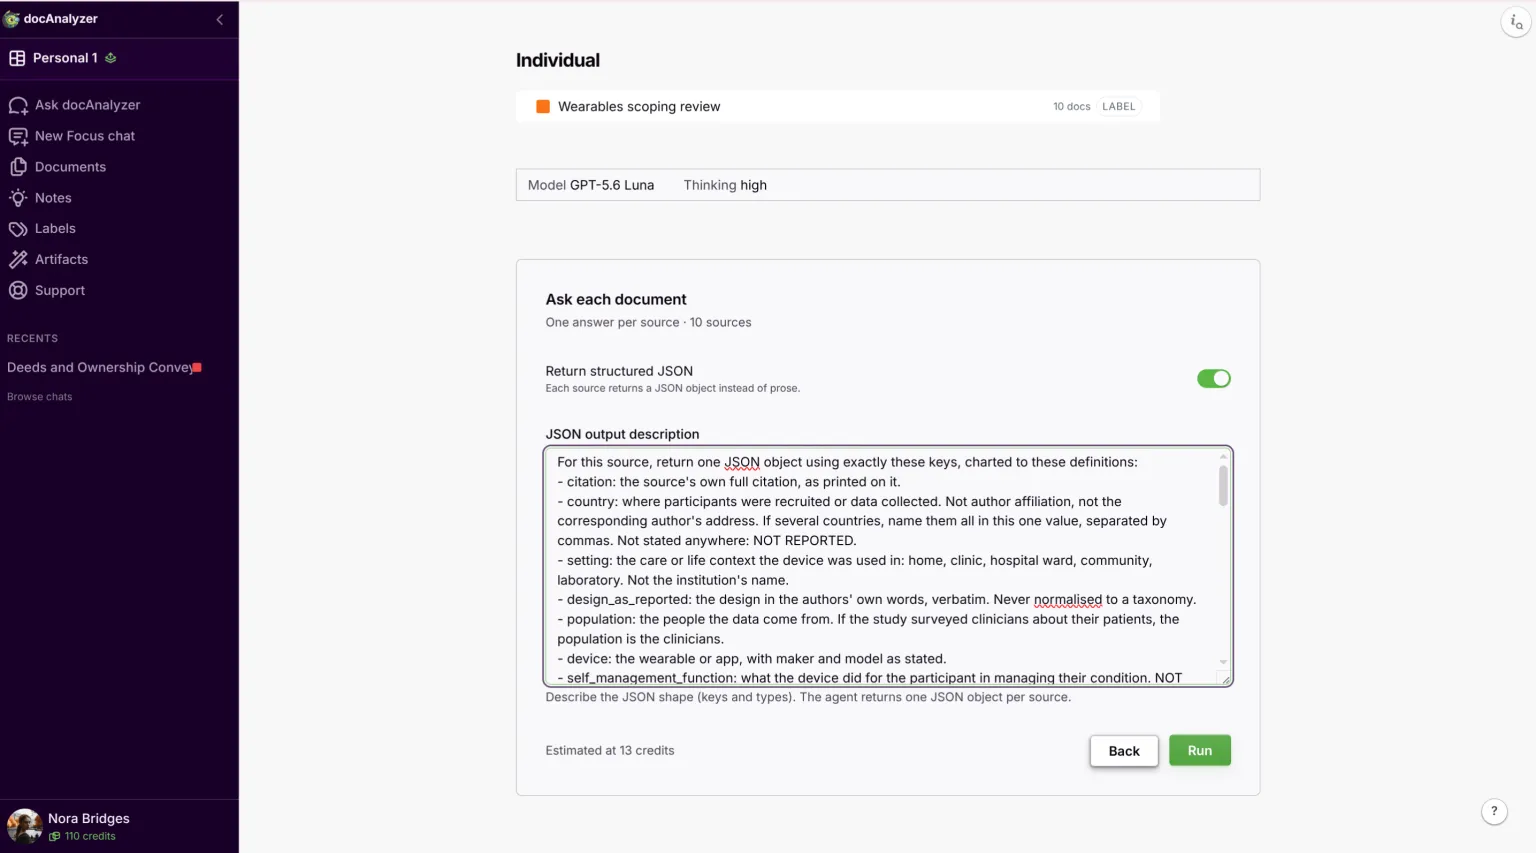
- The screen that opens is headed with that name, your source count under it, and a summary of the run settings. Check the summary says the model and thinking level you set two minutes ago.
- Below the summary, the form is headed Ask each document. Turn on Return structured JSON. The field label changes to JSON output description.
- Paste your form into that field:
For this source, return one JSON object using exactly these keys, charted to these definitions:
- citation: the source's own full citation, as printed on it.
- country: where participants were recruited or data collected. Not author affiliation, not the corresponding author's address. If several countries, name them all in this one value, separated by commas. Not stated anywhere: NOT REPORTED.
- setting: the care or life context the device was used in: home, clinic, hospital ward, community, laboratory. Not the institution's name.
- design_as_reported: the design in the authors' own words, verbatim. Never normalised to a taxonomy.
- population: the people the data come from. If the study surveyed clinicians about their patients, the population is the clinicians.
- device: the wearable or app, with maker and model as stated.
- self_management_function: what the device did for the participant in managing their condition. NOT APPLICABLE when it was worn only so researchers could measure something.
- duration: how long participants used the device. NOT APPLICABLE where nobody wore anything, as in a survey or a protocol with no results.
- outcomes_measured: what the study set out to measure, as the authors name and group them. One entry per outcome as the source lists it; do not break a composite outcome into its parts.
- key_findings_candidates: findings that may bear on the review question, proposed for a human to adjudicate rather than stated as conclusions.
- funding: the funding statement as given. Absent statement: NOT REPORTED, not "none".
- conflicts: the declared conflicts. "None declared" is a declaration; no section at all is NOT REPORTED.
- author_stated_limitations: limitations the authors state. Never ones you infer on their behalf.
Every key maps to an object with exactly four fields:
- "value": what this source states
- "supporting_extract": the exact text copied from the source, or the exact cell value if it comes from a table or figure. Copy it, do not paraphrase. For a table value, copy the row label and column label with it, plus the units and any footnote that applies, because a cell on its own can be exact and still meaningless.
- "source_location": where it is. Give the printed page number and the PDF page number when they differ, and name the table, figure, section or supplement when the value comes from one. Example: "printed p. 4 / PDF p. 6, Table 2".
- "source_format": one of "text", "table", "figure".
"outcomes_measured" and "key_findings_candidates" are lists; each entry is an object with those same four fields. For both, follow the authors' own grouping: do not split one item into several because it contains several parts, and do not merge separate items into one.
Rules:
- Values reported ONLY in a table, figure or supplement are still reported. Chart them, set source_format to how the value appears, name the supplement in source_location, and put the exact cell or label in supporting_extract. Never mark something NOT REPORTED because it lacks a prose sentence.
- If the source does not report an item anywhere, including its tables, figures and supplements, set value to "NOT REPORTED" and leave supporting_extract, source_location and source_format empty. An absent value has no format; calling it "text" invents provenance for something that was never there.
- If an item does not apply to this source type, set value to "NOT APPLICABLE". This is a judgment rather than an absence, so cite the passage that establishes the item does not apply, in the same four fields.
- If the source is ambiguous, set value to "UNCLEAR" and extract the ambiguous passage.
- Chart what the source reports about the study, not about its authors or its publisher. An affiliation line, a corresponding address, or the journal's country is not a study characteristic.
- Never infer a value, never supply one from general knowledge, never fill a field with a plausible default.
- Record design_as_reported exactly as the authors name it. Do not normalise it to any taxonomy.
- "key_findings_candidates" are proposals, not conclusions. List findings that may bear on this review question: [state your question]. Do not summarise the whole source.
Two of those keys are easy to conflate, and settling it in the form beats deciding it per source afterwards. source_format is how the value appeared, source_location is where it sat, and a supplement is a place rather than a format: a table in a supplement is a table, prose in one is text, and the supplement gets named in source_location, which is where you will look for it anyway.
Be precise about what raising thinking buys. On the same thirty papers and the same form, the default effort left ten extracts that were not verbatim in the source; at high it left three. That test measured quotation fidelity on one corpus, once. It did not measure whether the model missed findings, which is the failure that matters more. Treat it as a local benchmark and pilot it on your own sources rather than as a setting that fixes accuracy.
Two limits worth knowing before you plan around them: Ask each document needs at least two documents and a paid plan, and Thinking Effort cannot be changed from its default on the free plans.
Four of those rules are carrying weight.
Extract, not quote. An earlier version of this form asked for a verbatim sentence. That silently taught the model to call a value absent whenever it lived in a table, which is where sample sizes and outcomes usually live. Asking for an exact extract plus a format tag fixes it.
Locate properly. PDF page 12 is often printed page 8. A verifier given only "page 12" opens the wrong page, gives up, and stops verifying. Ask for both when they differ, and for the table or figure by name.
Design as reported, grouping later. Ask for a clean taxonomy and you will get one, and you will have lost the information. A source calling itself a "prospective single-arm pre-post feasibility study" is telling you something that a field reading "quasi-experimental" is not. Grouping is a judgment, it belongs to you, and Step 9 keeps both columns.
Candidates, not findings. Deciding which findings bear on your question is an analytic judgment. The model proposes; you adjudicate against the relevance rule you prespecified.
Step 4. Pilot the form, with a second person
Pilot at protocol stage, before the full run, and not alone. JBI expects the draft form to be developed and piloted by at least two team members on a small number of deliberately varied sources. Two or three is JBI's number; I use five because the heterogeneity matters more than the count. Pick them to differ on purpose: one qualitative, one trial, one protocol, the longest one, and one you suspect sits at the edge of your criteria.
Both people chart the same five, independently, then compare. What you are calibrating is not the tool, it is the two of you: whether "setting" means the country or the ward, whether a pilot embedded in a larger trial counts as one source or two.
Then revise field definitions, decision rules and locators. What to look for:
- A field that returns a paragraph, which means you asked for two things in one column.
- A locator you cannot follow. If you cannot find the value from what the form gave you, the form is underspecified, not the source.
- A field that is empty across all five. Do not simply drop it. Non-reporting may be exactly what you are reporting, and five sources cannot establish that a variable is irrelevant. Keep it if its absence is a result.
- A source whose type does not fit the form at all. In my pilot, Mak 2024 was a trial protocol with no results yet. That is not a charting-form problem, it is an eligibility question, and the answer is the one in the gate above: stop, amend the protocol, reapply the criterion to everything already screened, update the counts, resume.
Record any revision you make after the protocol was registered as a dated amendment, explain it, and rerun the revised form across every source already charted. Revising the instrument is allowed. Revising it silently is what a reviewer will call post-hoc.
Step 5. Run the included set
Same form, same settings as the pilot. If you changed either after piloting, pilot again; a run whose configuration nobody tested is not a run you can report.
Go back through the same path: Labels, the ⋮ on your label's row, New Focus chat, chat settings if you need to check them, then Or run a workflow on N documents →, the Individual card, Return structured JSON, and your form pasted in. Bottom left of the form shows a credit estimate before you commit. Treat it as an estimate rather than a quote, and watch the running total on your first real run, particularly at raised thinking effort.
Then click Run.
You do not need to reconstruct your settings from memory. Every answer's ⋮ menu has Settings used, which opens a panel listing the model, thinking effort, adherence, budget and the date that answer was produced with, rather than what the settings panel happens to be set to when you look at it later. There is a Copy button under the list. Paste it beside your notes for this run: it is the same menu on every answer, so the export and the verification turns record themselves too. What it does not carry is the product itself, and Step 10 asks for that separately: the name, the developer, the version and the dates you ran and accessed it. The version is on the Support page under Account, beside the account details you would quote in a bug report. Record it once for the review, with the run dates. If you work in a tool that displays no version anywhere, say so in your methods in those words rather than leaving the field blank.
You land in a new chat, and the run continues in the background whether or not you stay on it. When it finishes, a chip appears in that chat carrying the workflow's name, the number of documents, and its status. Click the chip and a panel opens on the right listing every source with its charted object.
Step 6. Open a log to record your decisions in
The panel is where the output lives, not where you work. Each source's result sits there as a JSON object, complete and readable, and that is as far as it goes: you cannot sort it, filter it, or record that a value has been checked.
What you need before verifying is somewhere to write down what you decided about each value. Not a copy of the output, which already exists. A log.
Get the output out of the product first, though. The panel is where you read the record, not where you preserve it, and an account is not an archive.
There is no download in that panel, so the only route out is to ask the chat to write the finished workflow output to a dated JSON file, without reopening the reports, summarising, renaming keys or touching values. That makes the file a copy produced by a model, exactly like the workbook two steps from now, so give it the same treatment: reconcile it against the panel source by source and key by key before you trust it, and keep the reconciled file unchanged. Call it what it is in your methods, an archival copy of the workflow output reconciled against the run, rather than a raw export, and if the product later grows a direct download, use that instead and say so.
One setting first. This is not a quick answer: the assistant works through every source and builds the file as it goes, over as many rounds as it needs, and what stops it is running out of spending room rather than running out of patience. Open Chat settings from the sliders beside the ask box and push Credit Budget to its maximum. That dial is a ceiling, not a price. You are charged for what the turn actually uses, so a generous cap on a short job costs nothing, while a tight cap on a long one buys you a spreadsheet that stops at the sixth paper. You can watch the ceiling in the composer, which reads "Up to N credits" once you have set it.
While the panel is open, set Context Adherence Level to High. It starts at Balanced, which lets the model reach for general knowledge when it judges that necessary, and nothing in this step needs any: every cell is a copy of something the run already produced. High rather than Strict, because Strict also redirects anything it reads as off-document, and a request for a spreadsheet can qualify.
Then type this into the ask box of that same chat:
Read the result of the Individual JSON workflow that just finished in this chat and build a spreadsheet from it, as an .xlsx file. Put every row on one sheet, named charted_items, with one row per charted item and exactly these eight columns: document_name, field, value, supporting_extract, source_location, source_format, verdict, note. Give every field in every source its own row. For fields that returned a list, give each entry its own row and put the index in the field name, like outcomes_measured[3]. Every row must have all eight cells. Copy document_name, field, value, supporting_extract, source_location and source_format from the run exactly as they appear, and leave verdict and note as empty cells. Cover every source in the run, not a sample. Do not open the documents again, do not summarise, and do not fill in anything the workflow left empty.
Reword it if you like, but keep two things. Say which run to read, and forbid rereading the papers. This chat is grounded on the same sources, so a looser prompt gets you a fresh extraction rather than the one you are about to verify, and the two are indistinguishable on the page.
One row per item, not one per source. Every row is one judgment, which is how the checking actually goes: ten papers with thirteen fields comes to roughly two hundred rows, forty papers to nine hundred, and both are ordinary spreadsheets.
Before you rely on the file, sort it by document and field and look for a repeated index. A list should run consecutively with nothing appearing twice and should match the run's output item for item. Whether it starts at zero or at one is the workflow's business and nothing downstream reads it; unbroken, unique and matching is what you are checking. Mine restarted partway through one paper and wrote six rows a second time, and the row count gave no sign of it: 241 where 235 was right. Duplicates quietly inflate every count you take later, and they are trivial to delete once you have seen them.
The extracts come along even though you will not read them here. You read those in Step 7, beside the page they came from. Their job in this file is to be the provenance that survives into the dataset you deposit, so hide the column while you work and leave it alone.
value starts as the charted candidate and gets edited in place when it turns out to be wrong. The original stays in the run's output, which is still in the panel and which nobody can edit by accident.
One thing to put back afterwards. Credit Budget is also what each paper may spend during a charting run, so if you go back to Step 5 for another run, set it deliberately rather than leaving it at the maximum you needed for this one turn.
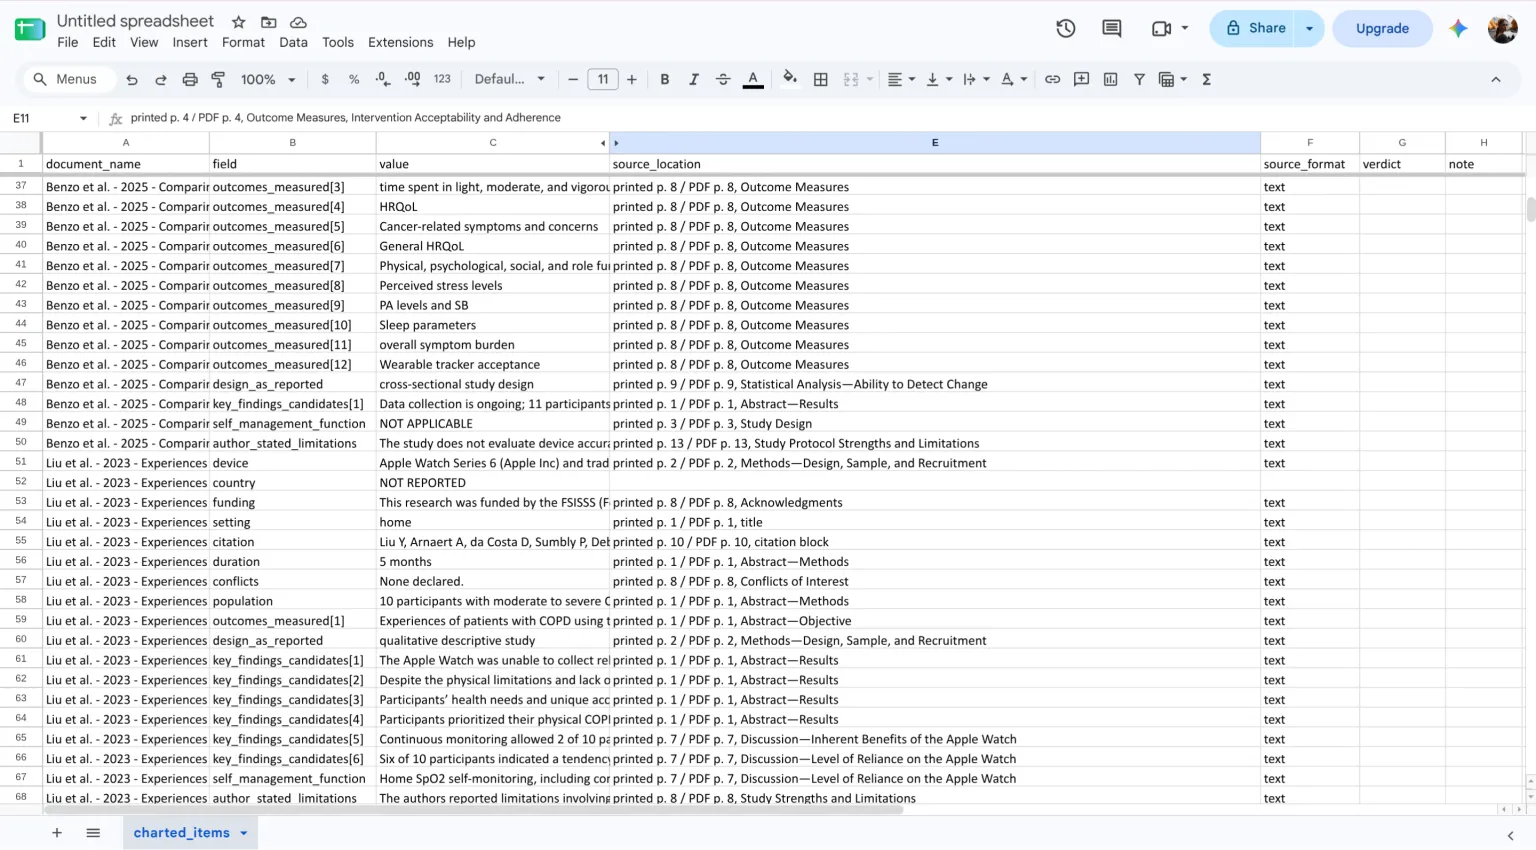
The answer comes back with a download chip in it, showing the filename on one line and the format and size on the next. Click it and the file downloads; open it in Excel or Sheets.
Four columns go on before you verify anything. Two you type: reviewer and verification_date. Who checked a value and when is part of the audit trail rather than a nicety, and it is the first thing anyone asks of a dataset claiming human verification.
Two you join. Open the inventory from Step 1 and bring evidence_id and study_id across by matching document_name exactly. Stop if a filename is unmatched or matches more than once: that is your inventory and your upload disagreeing, and every count downstream inherits it silently. The export cannot do this for you, because the run never saw your inventory, and a model asked for a column that is not in its input will invent one.
This is the join Step 1 was built for, and it has to happen here rather than later. Step 9 works in a chat scoped to this one file, so a column that is not in the file does not exist as far as your figures are concerned. Without it, a characteristics table counts uploaded files and a map labelled "studies" counts documents, and both look perfectly reasonable.
Three checks before you start, and the first is the one people skip. This step is not an export: the workflow's output is the record, and the spreadsheet is a second pass by the same kind of model, which can drop a row, reorder a list or duplicate a block without saying so. Say that in your methods, and reconcile the file against the panel before you verify a single value: the same sources, the same field names, list indices unbroken and matching the output, the same total item count, every field present and carrying the type your form asked for, all four provenance columns brought across, NOT REPORTED rows still holding empty provenance, and a few cells read side by side to confirm the text was copied rather than tidied.
Second, count the tabs. There should be one, named charted_items. Asked for a spreadsheet without being told how many sheets to use, the assistant may decide to build it in batches and give each batch its own tab, and one run of mine came back split across "Sources 1-4" and "Sources 4-10". Everything below assumes one sheet, and so does anyone who opens the file and reads what is in front of them. If you get more than one, say so in your next message and ask for the whole thing on a single sheet rather than merging the tabs by hand, and check the overlap before you throw the old file away: two tabs whose names both claim source 4 either duplicate it or mislabel it, and a duplicate here inflates every count you take later.
The third is coverage. The document names came back through the model too, so confirm they are the sources you think they are. Under the answer is a row of small buttons, and the last of them is a ⋮. Open it and you get Sources (JSON), Sources (CSV) and Sources (text), built from the document records rather than from the answer. Take the CSV. Its name column is your filename, and that is the column to check your sheet against: the same sources, all of them, nothing dropped and nothing doubled.
The other columns are docAnalyzer's own identifiers. source and nr are the document's number within that run, which is what the clickable citations in Step 7 are built from, and docid is its permanent id in the app. You will meet all three again if you use the API or work with files the assistant generates. None of them is your evidence_id, and the run numbering belongs to the run, so join on the name.
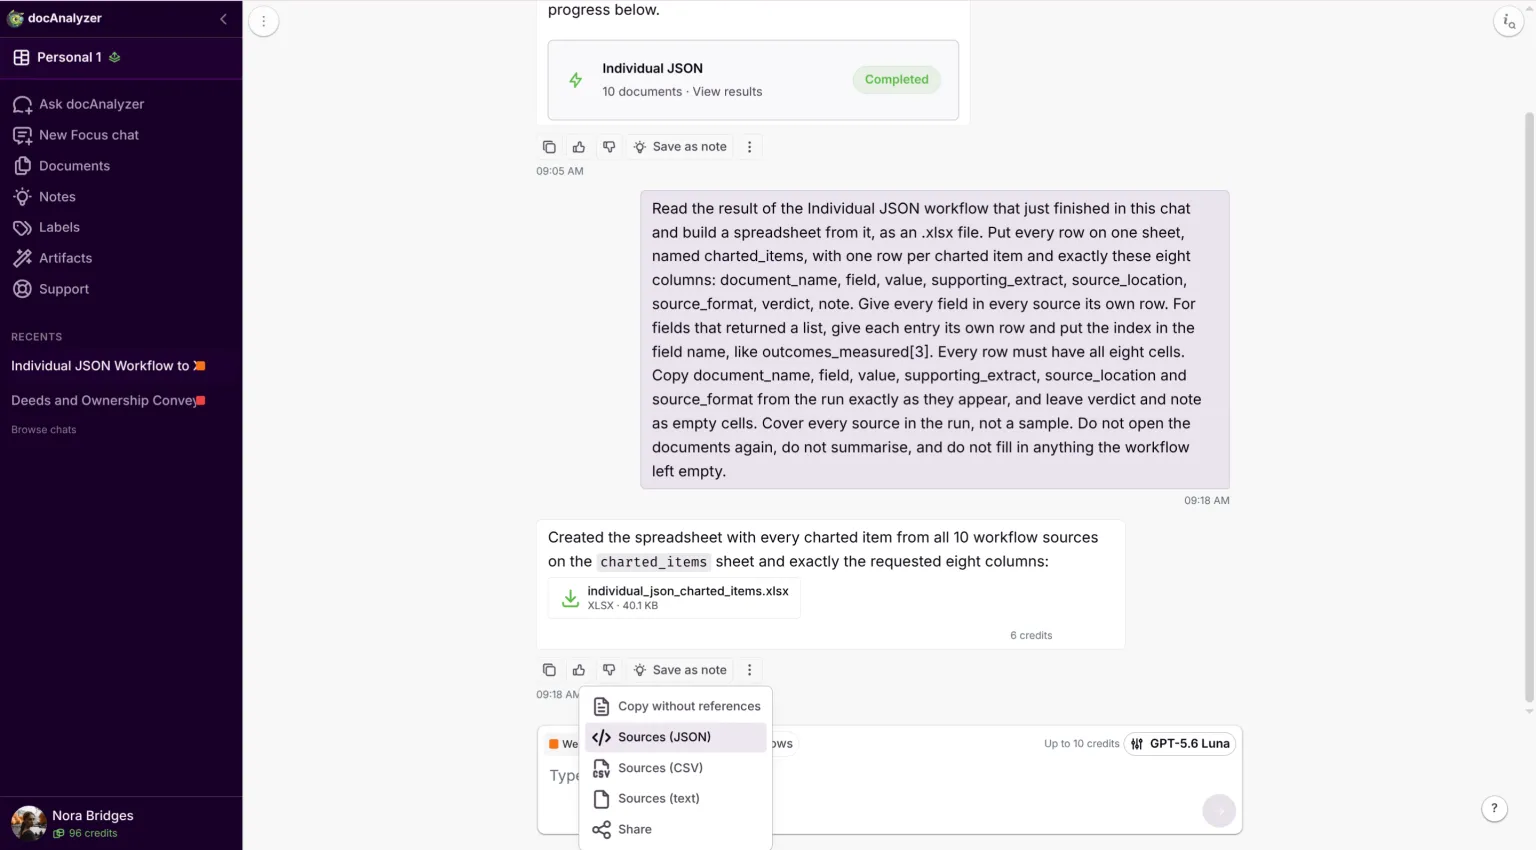
This is also why Step 2 had you record each filename in your inventory: the names in that list are your filenames, so a row lands in your inventory without matching titles by eye.
Step 7. Verify against the source, with the source open
Every row in that sheet is a candidate value with an empty verdict. Now the work that makes it a review.
A human verifies every field that will reach any table, count, chart or narrative, including every NOT REPORTED. What you do not do is sit with the spreadsheet on one screen and forty PDFs on the other, hunting page numbers. Go back to the chat the run happened in. It is grounded on the same sources, it can read the run's output, and unlike the workflow panel its answers carry citations you can click. Work one source at a time:
Read the result of the Individual JSON workflow that ran in this chat and take the object it returned for the document named . Answer in your reply, not as a file. Go through every key in that object, in order. For each key give me the value exactly as the run recorded it, then its supporting_extract quoted in full with no ellipsis and nothing shortened, then the source_location the run recorded, then a citation to the page where that extract appears in the document. Where the value is NOT REPORTED, say so and move on: there is nothing to locate. Do not chart anything again; find what the run already returned rather than looking for new values. If an extract is not in the document, say so and flag that field rather than quoting something near it.
Three things in there are load-bearing. In your reply, not as a file, because you have just watched this chat build a spreadsheet and it will happily build another, and a file has no citations to click. In full, with no ellipsis, because an extract you cannot read whole is one you cannot check against the page. And call the paper by name: paste the string from your sheet's document_name, which is the same string the panel shows and the same one the citations come back with.
Click a citation and the document opens in the panel beside the chat, at that page. Citations arrive labelled with the document name and the page, so you can see where a link goes before you follow it. That is the whole point of doing this here: the navigation you were about to do by hand is the one thing the tool is genuinely good at, and the charting workflow, for all its structure, throws it away.
Be clear about what that chat is doing. It is turning pages for you, not verifying anything. It is finding the passage; you are deciding whether the passage supports the value. "I could not locate this" is a prompt to look harder yourself, not a verdict, and a located extract is not a confirmed one.
Verification asks two questions, and most people only ask the first.
Is the value supported? Read the passage where it opens. You are not checking that the extract exists, you are checking that it supports the value. The dangerous field is not the invented one, it is the genuine extract attached to a claim it does not make. I got exactly that: for a paper with no funding statement, the value read "No specific funding source declared; the research was part of continuous quality monitoring and improvement of daily COPD care", supported by a real, verbatim sentence about the study's context. The sentence is in the paper. It says nothing about funding. Every automated check passes it, and so would a check that only confirmed the quote was real.
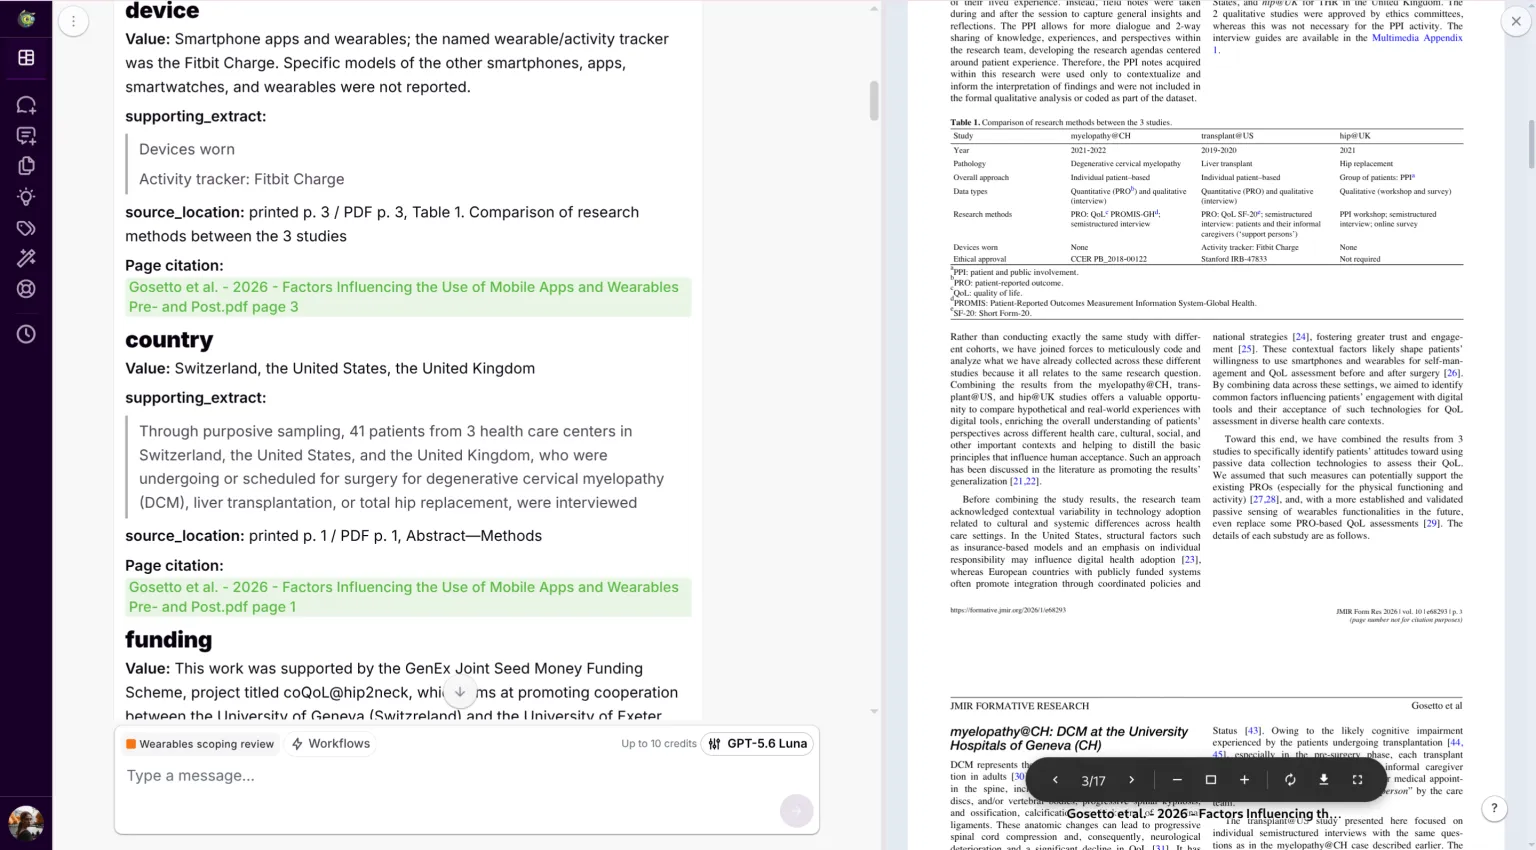
Is anything missing? Go to the source's tables, figures and supplements and ask what should have been charted and was not. No prompt helps you here, because a value nobody proposed has nothing to look up: you open the document in the viewer and read. This is the check that catches a false NOT REPORTED and an outcome the model never mentioned, and it is the half people skip. Every answer to it is an added row. Where the form returned key_findings_candidates, you decide which ones meet your relevance rule, mark the rest rejected, and add any it missed.
Record what you did as you go, one row at a time, while the source is still open. Four verdicts cover it:
- confirmed: the value is supported at the stated location. Leave
valuealone. - corrected: it is not. Edit
valueto what the source says, and say why innote. - rejected: the value does not belong in the dataset, either because nothing in the source supports it or because it does not meet the relevance rule you registered. Leave
valuewhere it is and say which innote. Rejected rows drop out when you build tables, and keeping them is what makes the rejection auditable. - added: nothing was charted here and something should have been. Write a new row, name the field, put in the value and its location, and note where you found it.
Expect to write added rows. The second question below is the one that produces them, and a check that ends in a row is a check you can show someone.
Reports of one source are consolidated here too, with the same four verdicts. This is Step 1's consolidation, done as verification rather than as a separate pass. What has to be true when you leave this step is one surviving row per evidence_id for each single-valued field, because that is what every table and figure below is built from.
Two reports that disagree are the case you expect: decide which value your review takes, mark the other rejected, and say why in its note. Two reports that agree are the case people miss. Nothing is wrong with either row, so nothing prompts you to touch them, and both survive into a characteristics table that then shows the source twice. Keep one and mark the rest rejected as duplicates.
Two reports can also each hold part of one value. The article recruits in Canada, the supplement adds a US site, and your form defines country as every country the study recruited in, so neither row is wrong and neither is a duplicate: the source's value is both. corrected is the verdict, on one row, to the value your definition asks for. What that row then owes you is its trail. Name every contributing report in the note with the place in it the addition came from, and mark the other row rejected as superseded rather than as wrong, so it stays in the workbook with its own extract and location. Skip the note and you have published a value that cites one report for evidence only two reports together support, which a reader discovers by following your citation and finding half of it.
Whether a field works this way is set by your charting form, not decided row by row at this step. country takes every country in one value because Step 3 defines it that way. outcomes_measured comes back one item to a row because the workflow returns it as a list. Read the definition you registered, and if it does not settle the question, that is a form defect to amend and rerun rather than something to resolve differently for each source.
A list field is different again, and consolidating it that way would destroy data. Where the article names three outcomes and the supplement names five, the reports are not in conflict, and the source's list is the union of both. Keep one row per unique item, mark true duplicates rejected, and leave every retained item on its own row with the location it came from. Never collapse a list into one cell: outcomes_measured[4] is a row of its own because what comes later counts items, not the sources that carry them. The indices do not need to close up afterwards, since nothing reads them.
Before you build anything in Step 9, check both shapes hold: every single-valued evidence_id and field pair has exactly one surviving row, and no item appears twice in one evidence_id's list.
Two filters carry the work. value equals NOT REPORTED gives you exactly the set this step says to check rather than trust. verdict still blank gives you what is left to do.
Budget for this properly. Each source costs one more grounded turn on top of the charting run, so verification is the same order of credits as the charting, not a rounding error against it. It is a much larger order of your time.
The workflow supplies candidate entries. It is not an independent human charting pass, and the verification chat is not one either. A human verifies. Whether that satisfies your protocol's dual-charting arrangement depends on what you registered, and if your protocol says two independent human charters, none of this replaces either of them. Do not describe the tool as a reviewer.
When every row has a verdict, the sheet is your dataset. Lock it and upload it back as a document: docAnalyzer accepts .xlsx, so it becomes a source like any other.
- Sidebar, Documents, Add, Files tab, and upload the finished file. Give it a label of its own or none at all, but do not put it under the review's label, or your next run over that label will chart your own dataset as though it were a paper.
- Wait for it to finish processing.
- Find its row, click the ⋮, and choose New Chat. That opens a chat scoped to this one file and nothing else, at the default settings: Step 9 starts by putting them where you want them.
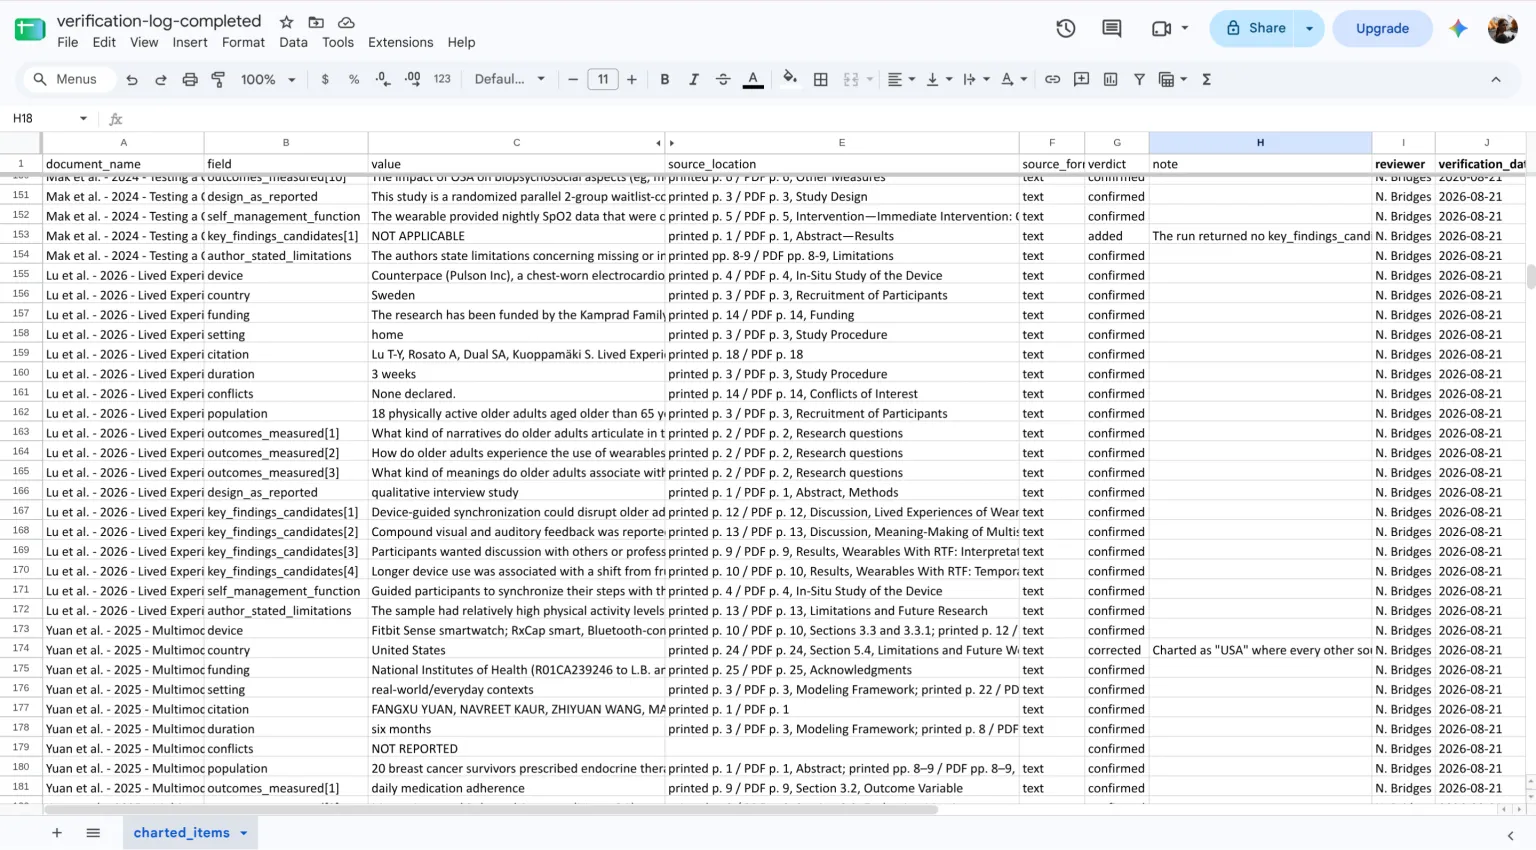
From here, one rule with no exceptions. Every table, count, chart and narrative statement in your review comes from the locked dataset, and from nothing else. The charting chat still holds the model's original answers, uncorrected, alongside every conversation you had about them. Ask it for a figure now and you will publish the errors you already found and fixed, and nothing will warn you. That is why the figures happen in a different chat, on one file.
Step 8. Reconcile two counts, not one
Keep two separate numbers and never let one edit the other.
The included-source count comes from your screening record. It is the number in your PRISMA-ScR flow diagram, and charting cannot change it.
The extraction audit is separate: sources eligible, files uploaded, results returned, results verified, failures unresolved. The panel prints "No output for this source" where a file produced nothing, and a run can return something malformed. In one of my runs, one paper in ten came back as invalid output.
A failed extraction means a source is missing from your dataset. It does not mean the source is no longer included. Rerun it or chart it by hand. Never adjust the flow diagram to match a software failure. The included count answers a question about screening, and no charting result can change the answer.
Step 9. Figures, from the locked dataset only
Work in the chat you opened on the locked dataset at the end of Step 7. That chat has one source and no history, which is the point: there is nothing else in it for a figure to be built from.
Set it up before you ask for anything. A new chat starts at the defaults, so nothing you set in Step 3 carries over: Thinking Effort is back to whatever the model starts at, and Context Adherence Level sits at Balanced. Open Chat settings from the sliders beside the ask box, raise Thinking Effort again, and set Context Adherence Level to Strict, which the panel describes as working almost exclusively from your documents. That is exactly the rule this step runs on, and Balanced leaves the door open for a plausible number from general knowledge to appear in a figure that is supposed to contain only your data. If Strict makes it balky about a request you consider reasonable, High is the next stop down.
Tables come back in the chat where you can read them; charts arrive as a download chip and open in a file. Ask for one thing at a time and check it before asking for the next, and treat what comes back the way you treated the charting run: a candidate. Everything in this step is model output built on top of the work you have just finished verifying, and a plausible table is the easiest thing in this guide to accept without looking. Raise Credit Budget here too, in the same settings panel: this chat is scoped to one small file so it opens with a low ceiling, and the characteristics table alone ran to five credits on my ten.
Descriptive summaries. PRISMA-ScR asks you to summarise or present the characteristics of your sources. Charts are one way, not a requirement, and a table is often better.
Grouping designs is where this needs care, because the form deliberately kept them as reported. In the dataset they are the value of every row whose field is design_as_reported:
Take every row whose field is design_as_reported and group its value into these categories: . Leave out rows whose verdict is rejected, and rows whose value is NOT APPLICABLE or NOT REPORTED; those are not categories. Give me a table of document_name, original value, assigned category, so I can check the mapping before anything is counted, and tell me how many rows you left out and which sources they came from.
Check the mapping yourself, then report the rule in your methods. Grouping is a methodological decision, and it goes unreported when people treat it as formatting. Keep the original wording beside the category: a category without the phrase it came from cannot be audited.
The row references in that reply are clickable. Click one and the dataset opens beside the chat at that row, highlighted, so checking an assignment means reading the value the model used rather than trusting that it read it. This is Step 7's move pointed at your own file instead of a paper, and it is the reason the mapping is checked here rather than in a spreadsheet: every assignment is one click from the row it came from, where in a spreadsheet it is a lookup you do by hand.
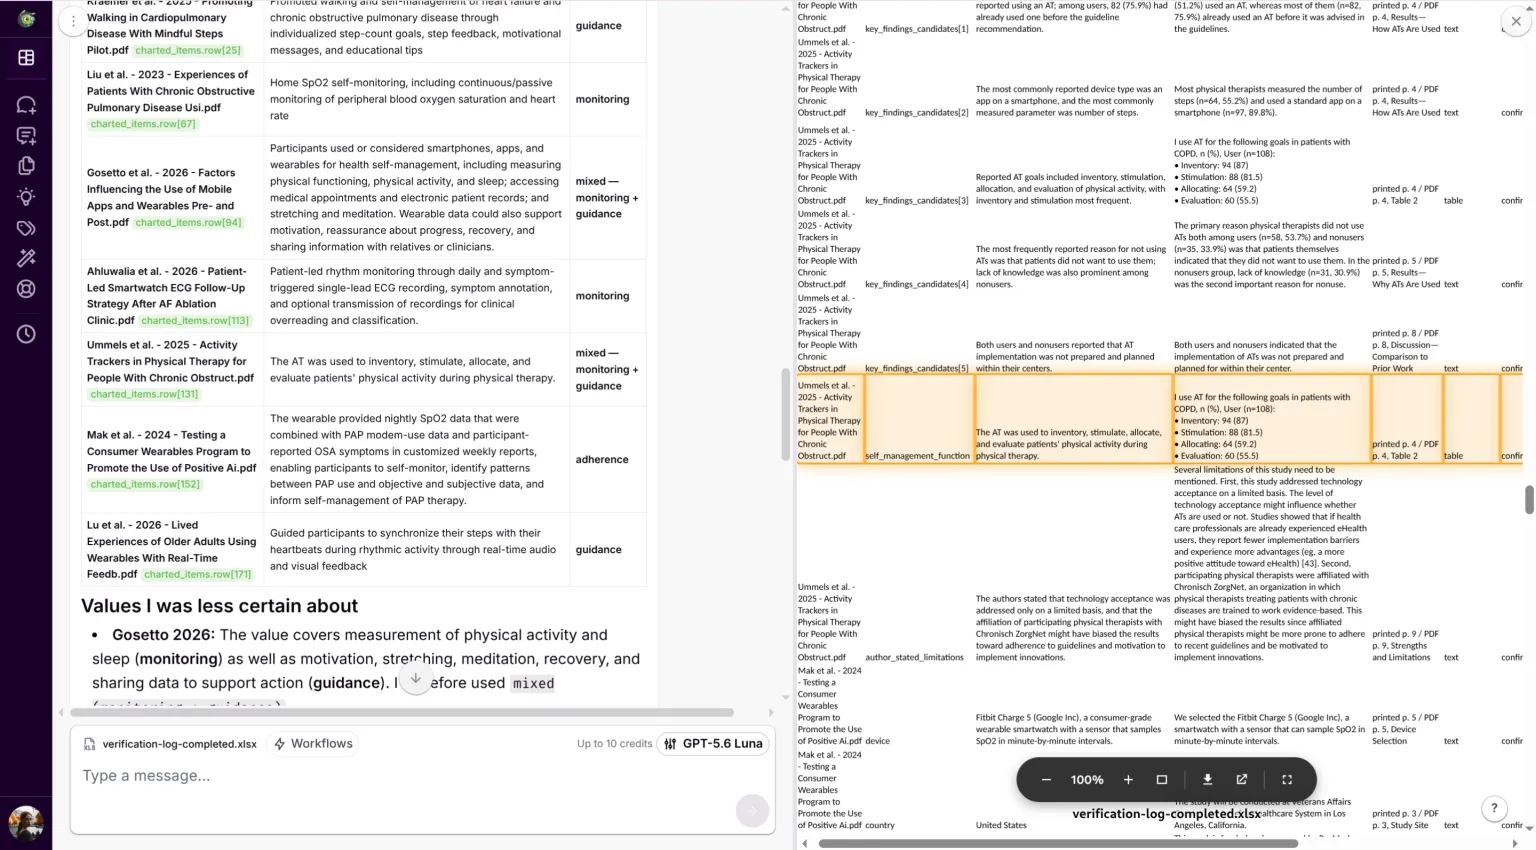
Correct it here rather than in a spreadsheet, and correct it out loud. Name the assignments you are changing and ask for the whole mapping to be restated before anything is charted:
Kraemer's setting is home, not mixed: free-living daily use is the substance and "community" adds nothing here. Restate the full corrected mapping.
That turn is not a formality. Everything below is built from the mapping in this chat, so if the corrected version is not the one sitting in it, your figure and your reasoning part company and nothing on the page will say so. Restating it puts the version the figure comes from where you can read it.
When a mapping is settled, copy the restated version straight into your supplement, beside the prompt that produced it. It is three columns and one row per source, and it belongs with the methods you are writing anyway rather than in a file of its own. A mapping that exists only in a conversation has no reporting home: a reader can see your counts without being able to reconstruct how free text became categories, and that is the part of a grouping decision that gets left unreported.
Your characteristics table is a pivot of the same file. One row per item is the right shape for verifying and the wrong shape for publishing, so turn it at the end rather than the start. Ask for it in the reply rather than as a file, and name the fields you want:
Show me a characteristics table in your reply, not as a file: one row per evidence_id, with a column for each of country, design_as_reported, population, device, duration. Use the value column and leave rejected rows out. If an evidence_id has no surviving value for one of those fields, or has more than one, stop and list those cases instead of picking a value.
That last sentence is what turns the table into a check. Without it a source with two surviving values gets one of them silently, and you never learn that the consolidation in Step 7 was left half done. If the reply comes back as a list of evidence_ids rather than as a table, that is the check firing, and the repair belongs in the verification log rather than in the prompt.
Then check it, and check for the right failure. The values are copied from a file the model is holding, so a wrong value is unlikely; a missing one is not. One of my runs reported a source's duration as "no duration value identified" when 5 months was sitting in the dataset. Read down each column for blanks and for hedges like that, and take any you find back to the row. The cells carry charted_items.row[N] addresses, so a value you doubt is one click from the row it came from, and a blank is one lookup from the value that should have been there.
Choose the columns. All thirteen fields at full length is unreadable in a chat pane and is not what a characteristics table is for; five or six is what gets published. Keeping it in the reply matters more than it sounds: you will change your mind about the columns two or three times, and a file for each attempt is clutter you then have to tell apart. When the shape is settled, copy it into your manuscript. It is a table you were always going to publish, and it does not need to become a spreadsheet on the way there.
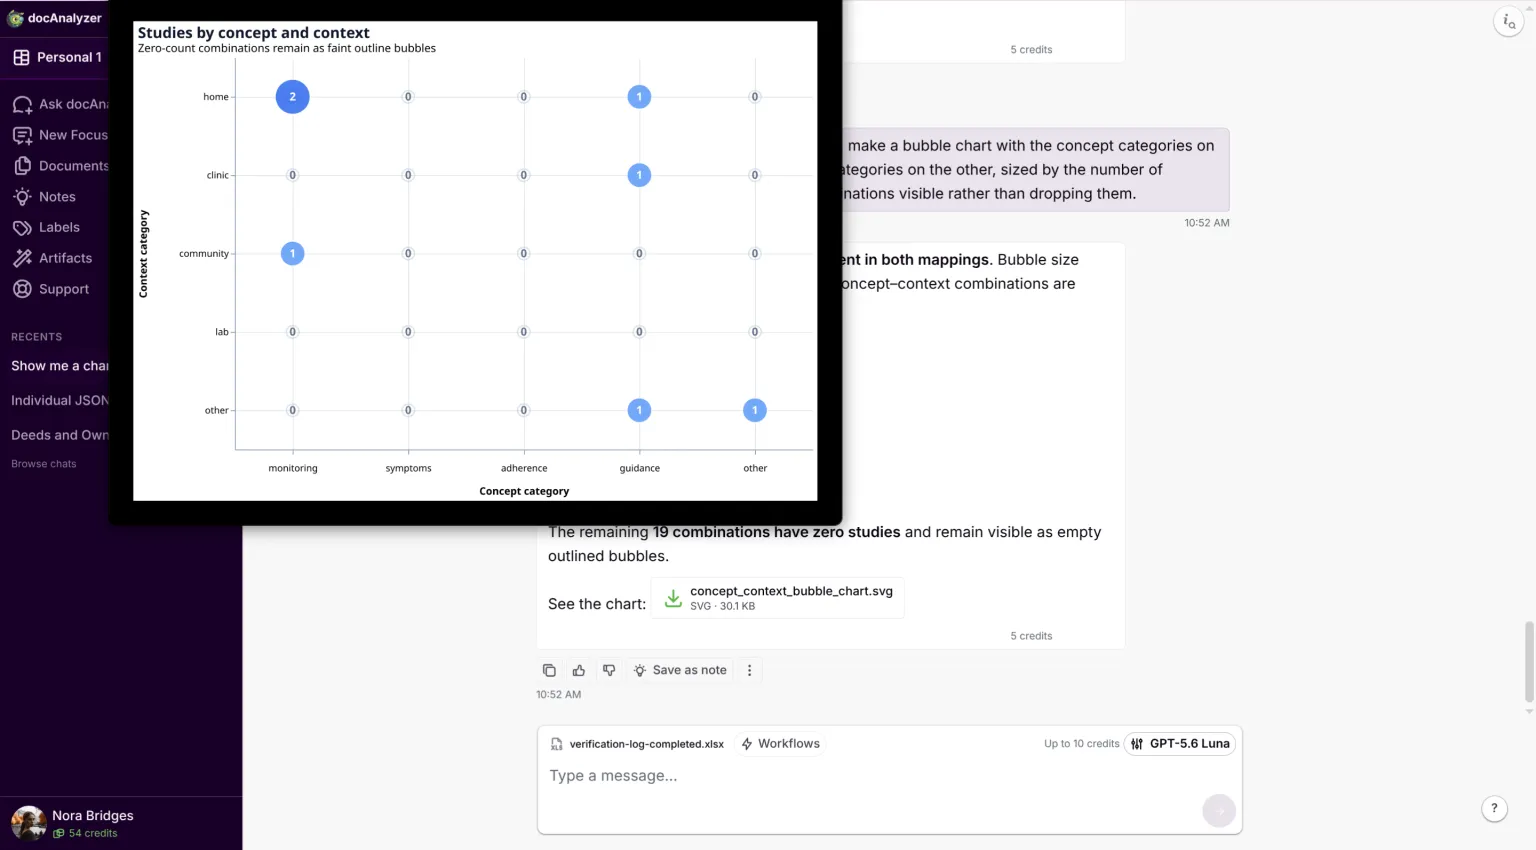
The evidence map. A bubble chart of concept against context, sized by the number of studies. Sized by studies means studies, which is why study_id was joined in at Step 6: count distinct study_id, never rows, because a source with three files would otherwise weigh three times a source with one. Where every source is its own study the two agree, and the column costs you nothing. Neither axis is a column, though: what the dataset has is your charted values, and those are free text where every entry is unique. Chart them raw and you get a diagonal of ones. Both axes are categories you assign first, the same move as the design grouping above, once per axis:
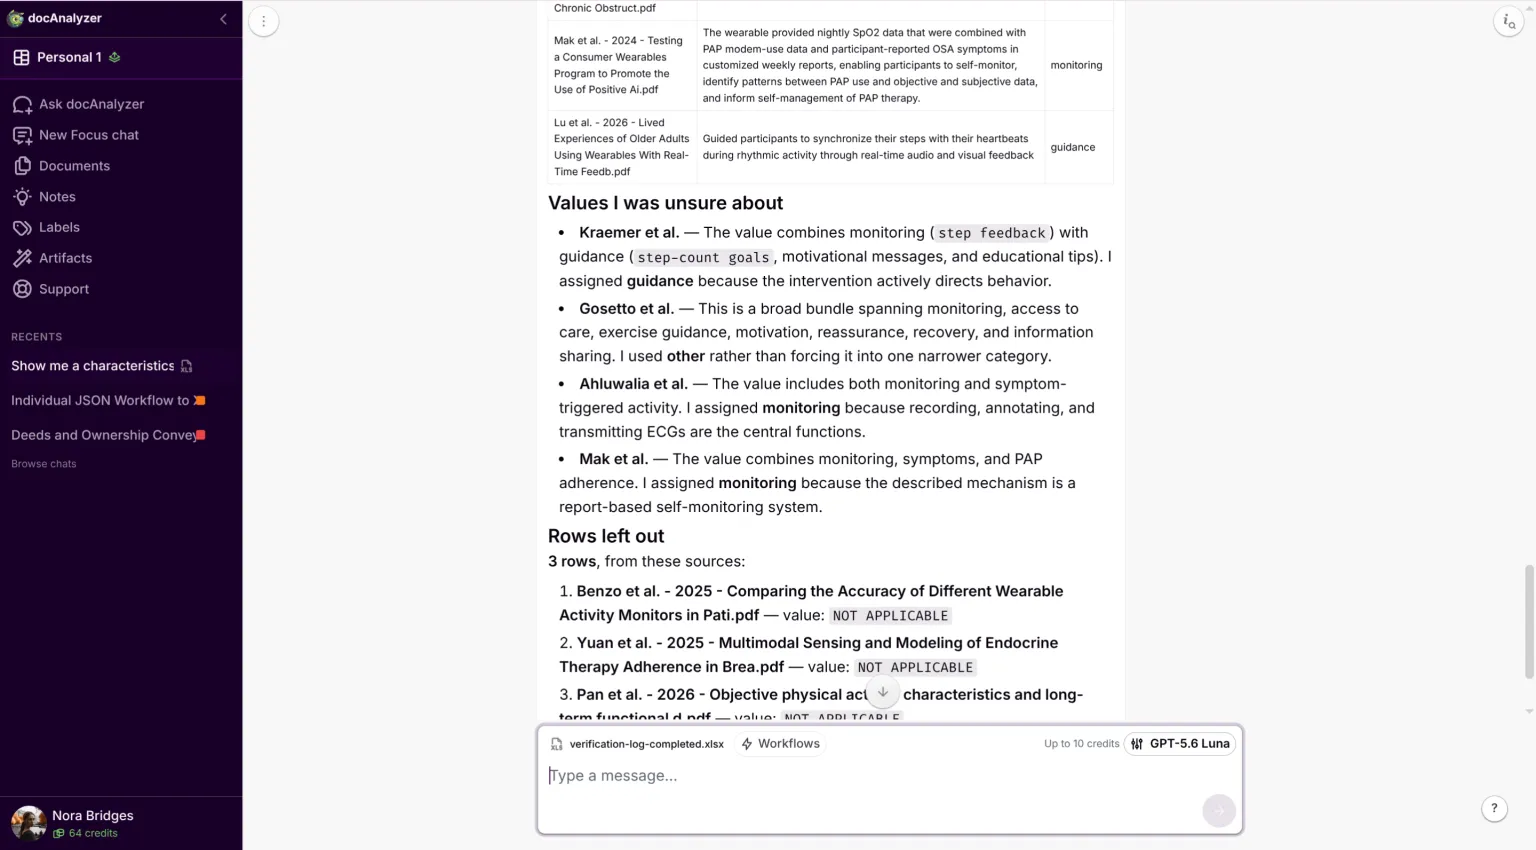
Take every row whose field is self_management_function and assign each value to one of these categories: , mixed, other. Assign the single category the source's primary function fits. Use mixed only when two categories are genuinely co-equal and naming one would misrepresent the source, and say which two. Use other only when none of them applies. Leave out rows whose verdict is rejected, and rows whose value is NOT APPLICABLE or NOT REPORTED; those are not categories. Give me document_name, original value, assigned category, so I can check the mapping, and tell me how many rows you left out and which sources they came from.
Do the same for whichever field carries your context, usually setting, grouped into something like home, clinic, community. Keep the category names short: they become axis labels, and a long one is truncated in the middle rather than wrapped.
mixed and other are doing different jobs and the distinction is worth insisting on. A study run in a clinic and at home fits two of your categories; a study described only as "real-world everyday contexts" fits none. Collapse them into one bucket and it becomes the biggest cell on your map while meaning nothing, which is the same failure as letting NOT APPLICABLE in.
mixed needs the tighter leash of the two, and how you ask decides it. These fields are prose, and prose is rarely about one thing: a smartwatch that records ECGs and lets you annotate symptoms mentions two categories and is doing one job. Ask for mixed whenever a value mentions more than one category and you will get it for almost everything, which leaves a map with a single populated row and nothing to read from it. Ask for the primary function, and reserve mixed for values where two categories are genuinely co-equal.
Check both mappings, then:
Using the corrected mappings you restated above, make a bubble chart with the concept categories on one axis and the context categories on the other. Size each bubble by the number of distinct study_id, joining each mapped document_name to its study_id in the dataset, not by the number of rows. Keep empty combinations visible rather than dropping them.
Sources charted NOT APPLICABLE on an axis drop out of the map. That is why the prompt says to leave them out and to report how many: left in, they land in other, and a category that means "did not fit" quietly absorbs sources that mean "did not apply". It is worth saying in your results rather than leaving the reader to subtract: in my ten, three sources were worn only so researchers could measure something, with no self-management function at all, so the map covers seven. Give all four numbers and the reader never has to reconstruct any of them: sources included in the review, distinct studies among them, studies that fall outside this map and why, and studies the map shows. Where every source is its own study the first two are the same number, which is worth stating rather than leaving to look like an oversight.
Check the chart before you believe it, and check the arithmetic rather than the picture. The bubbles count studies, so check it in studies: ask for the populated cells with their counts, and the study_id and document_name values in each. Three things have to hold. The counts sum to the number of distinct study_id values left after the dropouts above — the studies the map covers, seven in my ten, not the studies in the review. Not your number of sources either, which matches the studies only where every source is its own study and exceeds them everywhere else. Each study_id appears in exactly one cell. And the sources named in each cell are the ones you approved in the mapping, which is the step where a reassignment would otherwise slip in unnoticed. Reconcile those three and the chart is as verified as the values under it; skip them and you have checked five hundred fields by hand and taken the last number on trust.
A study_id in two cells is not automatically an error to correct. Two sources describing one study can each be charted accurately and still fall on opposite sides of a category line, so there is no wrong row to reject. What the map needs is a decision one level up: choose the category the study takes, apply it to every source carrying that study_id, and record it in the mapping you approve before the chart is drawn, beside the source values it overrides. The decision then sits in an artefact a reader can inspect rather than in the shape of the picture. If your protocol deliberately allows one study to occupy more than one cell, say so in the caption and stop presenting the cell counts as a total, because they no longer sum to anything.
Empty cells are candidate gaps, not findings. A cell is only evidence of a gap if your search scope and eligibility criteria could have found something there and your grouping is defensible. Say that when you report it.
Step 10. What to report
Everything above is unreportable unless you kept the pieces. Keep: the protocol and its dated amendments, the charting form as finally run, the tool and version, the model and settings, the dates, the reconciled archival copy of the workflow output, and the locked dataset. The dataset records the decisions: its verdict and note columns record what was confirmed, corrected, rejected and added, its reviewer and verification_date columns record who decided and when, and its evidence_id and study_id columns are what makes a source count and a study count reproducible from the file alone. What it does not record is what the tool first proposed, because value was edited in place. The candidate sits in the archived output, so the two together are the correction history and neither is it alone. That is the reason to deposit both. Keep the corrected mappings as you reported them, and the prompts that produced them, since the counts in your figures come from categories you assigned rather than from the charted values directly.
Cochrane, the Campbell Collaboration, JBI and the Collaboration for Environmental Evidence issued a joint position statement on AI in evidence synthesis in 2025, building on the RAISE recommendations. Under its recommendation on adhering to established reporting standards, it lists five things authors should generally report. They map onto what you have been keeping:
| What to report | Where it comes from in this guide |
|---|---|
| Name, version and dates of the tool | Version from the Support page, under Account; Settings used gives the model, the settings and the date of each answer |
| Purpose, which parts of the process it touched, and how it was used | Steps 3 and 5; cite your prompt |
| Justification that it is methodologically sound, how it was validated or piloted, and steps taken to verify outputs. Make prompts, outputs and data publicly available where practical | Step 4 pilot and Step 7 verification; deposit the form and the locked dataset |
| Financial and non-financial interests in the tool, and the tool's funding | yours to declare |
| Limitations and potential biases, with their likely impact | Step 7's two failure modes |
The same statement says decisions to use AI should be considered and reported as part of protocol development. That is before you upload, not at write-up, and it is another reason the gate at the top of this guide is where it is. Their protocol-stage template:
We will use [tool name, version, date] developed by [developer] for [purpose] in [which part of the process]. The tool will [describe customisation or parameters]. Outputs are justified for use because [how you determined it is methodologically sound and how it was validated or calibrated for this review]. Limitations include [known limitations, biases and ethical concerns].
For the methods section, something like:
Data charting. We developed and piloted the charting form on [n] sources with [reviewers] and revised [fields and rules] as recorded in protocol amendment [x]. [Tool, version or "no version is displayed", developer], using [model, thinking effort and context adherence level], generated report-level candidate values on [dates] from the prompt in Supplement [x]. The same tool then transformed that output into a verification workbook; this is a second model pass rather than an export, and we reconciled sources, field names, list indices and item counts against the original output before using it. During verification a document-grounded chat located the extracts, but [reviewer] decided whether each value was supported, and read every report, including its tables, figures and supplements, for values that were never proposed, including every NOT REPORTED. [Second reviewer or reconciliation process] verified the charting as specified in the protocol. We consolidated the verified report-level rows to source level under the field definitions registered in the form: duplicate values were reduced to one row, disagreements were adjudicated with the value taken and the reason recorded, complementary values were combined into the value the definition requires with every contributing report named, and the superseded rows were retained with their own extracts and locations rather than deleted. The tool proposed the category assignments used for grouping and mapping; [reviewers] checked and corrected them, and the mappings as finally used are reported in Supplement [x]. It generated the characteristics table and the evidence map from the locked dataset and those corrected mappings; [reviewer] reconciled every cell and every cell count against the dataset before either was used. We retained the prompts, an archival copy of the complete workflow output reconciled against the run, the locked dataset with its verdicts and notes, the mappings, the model settings and the dates in [repository or supplement]. The tool did not determine eligibility, conduct critical appraisal or interpret the evidence.
On disclosure, ICMJE is explicit and worth reading in full. AI tools cannot be authors. Disclosure goes both in the cover letter and in the submitted work, describing how the tool was used. Humans are responsible for all submitted material, including checking output that "can be incorrect, incomplete, or biased". Nondisclosure "may be construed as misconduct". Check your target journal's submission system too, since many now have their own AI field.
The cover letter is the half people forget, because the methods paragraph feels like the disclosure. It is shorter than the methods text and does a different job, which is to tell an editor what was used before they read anything:
This submission used [tool, version or "no version is displayed", developer] to draft data-charting values from the included reports, to produce the verification workbook, to propose the category assignments used for grouping, and to generate the descriptive table and figure, as described in Methods. Every charted value was verified against its source by the named authors, who take responsibility for the content. The tool did not determine eligibility, conduct critical appraisal or interpret the evidence.
Guidance in this area is moving quickly, and both documents above are recent. Read the current version rather than my summary of it before you submit. The ones this guide leans on, by name, so you can find the current text rather than trusting my paraphrase:
- JBI Manual for Evidence Synthesis, the scoping review chapter, for the charting method and the pilot expectation.
- PRISMA-ScR, the reporting checklist and its explanation paper, for what a completed review has to report.
- PRISMA-S, for reporting the search, which sits upstream of this guide but is the other half of what a reviewer will ask for.
- The 2025 joint position statement on AI in evidence synthesis from Cochrane, the Campbell Collaboration, JBI and the Collaboration for Environmental Evidence, with the RAISE recommendations it builds on.
- ICMJE Recommendations, the section on artificial intelligence in submitted work.
- COPE's position on authorship and AI tools.
The decisions stay where they were. What is in and out is the protocol's and yours. Whether appraisal happens is a design decision. What the mapped evidence means is yours. The tool drafts inside that structure and replaces none of it, and you are answerable for every number that carries your name.
What this costs, and a note on product facts
Charting thirty papers at raised thinking effort took about twelve minutes of machine time. Uploading does not spend credits. Step 7's verification adds one grounded turn per source, so plan on it roughly doubling what the charting run spends rather than adding a trickle to it. Step 9 is not free either: two grouping turns, a table and a chart come to the same order as the charting run itself. Each turn shows the most it can spend before you send it.
Now the number that matters, because the one above invites a subtraction you should not make. This method removes the transcription, not the checking. The ten hours I described at the top were the clerical half: opening each paper, finding fourteen facts, typing them into fourteen columns without fumbling one. That half largely goes.
Step 7 does not go. A human still confirms every value is supported and goes through the tables, figures and supplements looking for what was never proposed, including for every field marked NOT REPORTED. On forty sources and fourteen fields that is several hundred judgments, and it is now the dominant cost of the method rather than a formality at the end. Verifying in the chat removes the page-hunting, which is real and is most of what made this unbearable, and it removes none of the judging. I have not timed a full verification pass at that scale and will not invent a figure for it, so budget it from your own pilot: time the five sources in Step 4 honestly, including the reading, and multiply.
If that arithmetic makes the whole thing look unattractive, you have learned something true before spending anything. The method is worth it when transcription is your bottleneck. It is not worth it if you were going to skip verification anyway, and a review built that way is worse than one charted slowly by hand.
Watch the pilot loop in Step 4 too. You will run it more times than you plan to, which is the point of it.
The numbers here come from one run of thirty open-access papers on one topic, charted with one form, verified by hand. They are a real measurement and they are one sample. Your sources are different and your form is different.
Prices, plan limits, credit charges, button names and model behaviour all change. This describes the product as of August 2026. Check the current pricing and help pages before relying on any specific number.
Corrections
If something here is wrong, tell us. Screens change, prices change, and a step that was accurate in August may not be in March. Write to [email protected] with the guide name and what you found, and we will correct it and date the correction.
Product trouble is a different queue: [email protected].
Last updated 25 August 2026.
Copyright and licence
© 2026 AI For Verticals, Inc. docAnalyzer® is a trademark of AI For Verticals, Inc.
This guide, its text and its figures, is published under the Creative Commons Attribution-NoDerivatives 4.0 International licence. Copy it, print it, put it on a reading list, send it round your department, host it yourself, commercially or not. Two conditions: credit AI For Verticals and link to the licence, and pass it on whole rather than as an edited version. Quoting it and citing it in your own work are neither of those things and need no permission beyond ordinary attribution. The licence covers the guide. It grants no rights in the docAnalyzer name or marks.
The screenshots reproduce content from ten open-access articles. That content is not ours and is not covered by the licence above. Each article is published under the Creative Commons Attribution 4.0 International licence, stays under it, and appears here as the tool displays it:
- Kraemer KM, Litrownik D, Wayne PM, et al. "Promoting Walking in Cardiopulmonary Disease With Mindful Steps: Pilot Feasibility Randomized Controlled Trial of a Web-Based, Pedometer-Mediated Mind-Body Intervention." JMIR Formative Research (2025). doi.2196/74118
- Benzo RM, Singh R, Presley CJ, et al. "Comparing the Accuracy of Different Wearable Activity Monitors in Patients With Lung Cancer and Providing Initial Recommendations: Protocol for a Pilot Validation Study." JMIR Research Protocols (2025). doi.2196/70472
- Liu Y, Arnaert A, da Costa D, et al. "Experiences of Patients With Chronic Obstructive Pulmonary Disease Using the Apple Watch Series 6 Versus the Traditional Finger Pulse Oximeter for Home SpO2 Self-Monitoring: Qualitative Study Part 2." JMIR Aging (2023). doi.2196/41539
- Gosetto L, Cockcroft E, Berrocal A, et al. "Factors Influencing the Use of Mobile Apps and Wearables: Pre- and Post-Surgery Quality of Life Assessment Study." JMIR Formative Research (2026). doi.2196/68293
- Ahluwalia N, Abbass H, Hussain A, et al. "Patient-Led Smartwatch ECG Follow-Up Strategy After AF Ablation: Clinical Trial Design and Implementation." JACC: Advances (2026). PMC12948591
- Ummels D, Bols E, Frantzen RJA, et al. "Activity Trackers in Physical Therapy for People With Chronic Obstructive Pulmonary Disease in the Netherlands: Cross-Sectional Study on Current Use and Implementation Determinants." JMIR Formative Research (2025). doi.2196/59533
- Mak S, Ash G, Liang LJ, et al. "Testing a Consumer Wearables Program to Promote the Use of Positive Airway Pressure Therapy in Patients With Obstructive Sleep Apnea: Protocol for a Pilot Randomized Controlled Trial." JMIR Research Protocols (2024). doi.2196/60769
- Lu TY, Rosato A, Dual SA, et al. "Lived Experiences of Older Adults Using Wearables With Real-Time Feedback: Phenomenological Study." JMIR mHealth and uHealth (2026). doi.2196/71509
- Yuan F, Kaur N, Wang Z, et al. "Multimodal Sensing and Modeling of Endocrine Therapy Adherence in Breast Cancer Survivors." Proceedings of the ACM on Interactive, Mobile, Wearable and Ubiquitous Technologies (2025). doi.1145/3770864
- Pan J, Wang Z, He Y, et al. "Objective physical activity characteristics and long-term functional disability trajectories in community-dwelling older adults: the amplifying risk of stroke." Frontiers in Public Health (2026). doi.3389/fpubh.2026.1792601